 Silver Rises Over 120% YTD




Ronnie Stoeferle’s $8,900 Gold Forecast Comes With a Warning

Gold could reach $8,900 by 2030, according to Ronnie Stoeferle. Yet he expects further downside before the next major rally. In this GoldSilver interview, he explains why his long-term outlook remains bullish, what could trigger gold’s next advance, and how he approaches gold, silver, and portfolio allocation.
Short-Term Pressure Pushes Gold Down
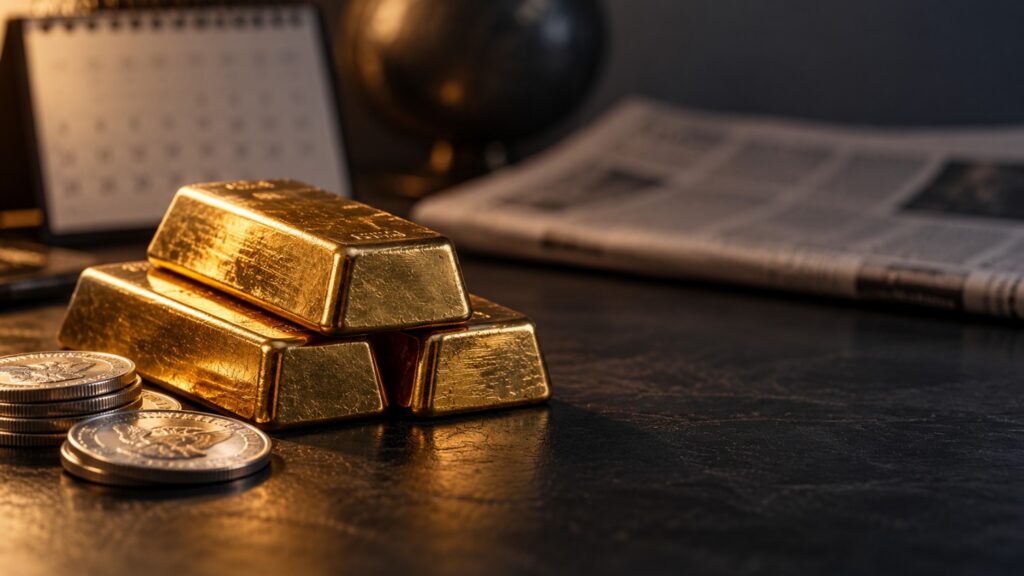
The dollar hit an 18-month high this week, CPI lands Wednesday, and gold dipped right on cue. None of it matters if you own metal to hold, not trade. Here’s the difference between tracking a calendar and owning insurance.
Five Moves Are Quietly Rebuilding Gold’s Entire Market Structure

ICE launched new gold futures in London, Hong Kong built a yuan-backed gold bridge to China, and Wall Street’s own forecasters can’t agree on gold’s next move. Five institutional shifts reveal what’s really reshaping precious metals markets beneath today’s headline price.
What Is Gold Backwardation? The Rare Signal That Struck 3 Times in 2025

Gold and silver flashed one of the rarest signals in precious metals three times in 2025. Here’s what backwardation means, why it kept happening, and why physical metal beats a paper promise when it strikes.
Owning Gold Was a Crime When It Went Up 5x
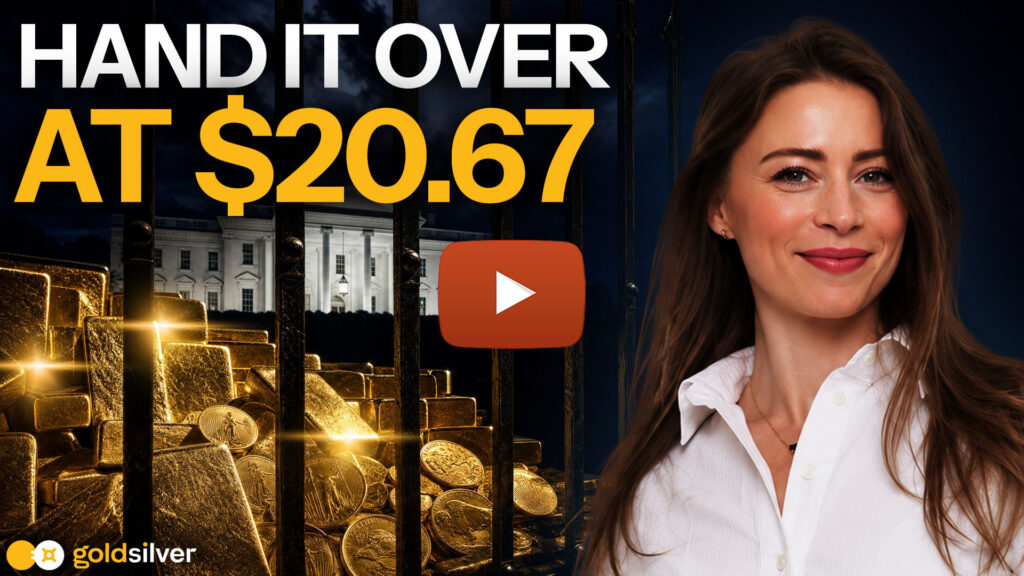
For 41 years, owning gold could get you fined or thrown in prison. It happened while gold ran from $40 to $850 an ounce. Here’s what Executive Order 6102 actually did, and whether it could happen again.
What Is a FOMC Meeting? What the Fed Decides and How Gold Reacts

The Fed just hiked rates for the first time since 2023, and gold’s reaction wasn’t what the textbook predicts. Here’s what an FOMC meeting actually decides, how the committee is structured, and the one number, not the headline vote, that actually moves gold and silver.
UBS Holds Its Silver Target. The Market Already Got There First.
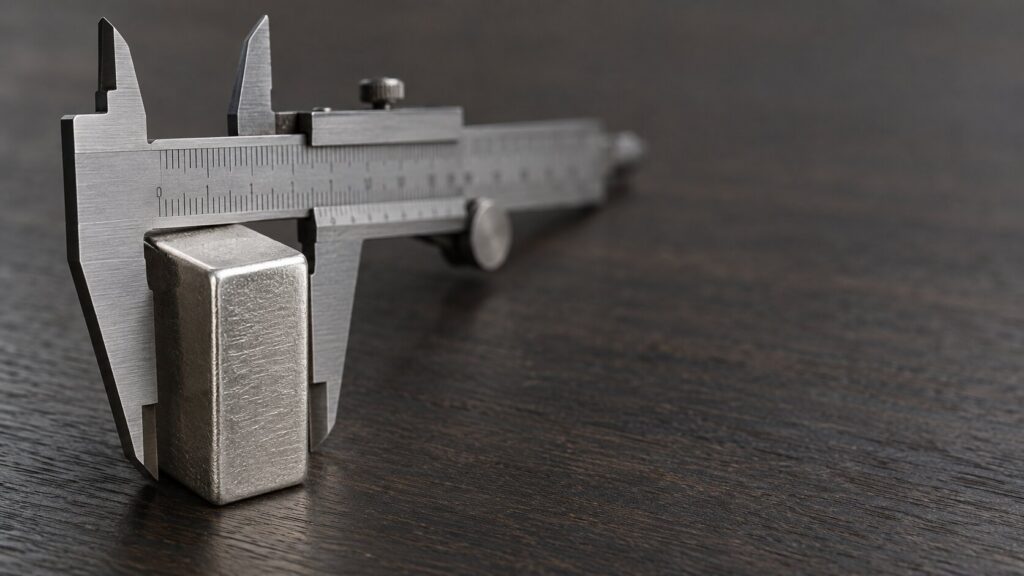
UBS’s silver forecast hasn’t moved since August. The gold-silver ratio has, falling to a 2-week low of 64.9 through a Fed rate hike that should have made silver’s job harder. The market got where UBS said it was going, before UBS noticed.
China Imported 1,000+ Tonnes of Gold in Eight Months. Its Central Bank Bought Only 80.
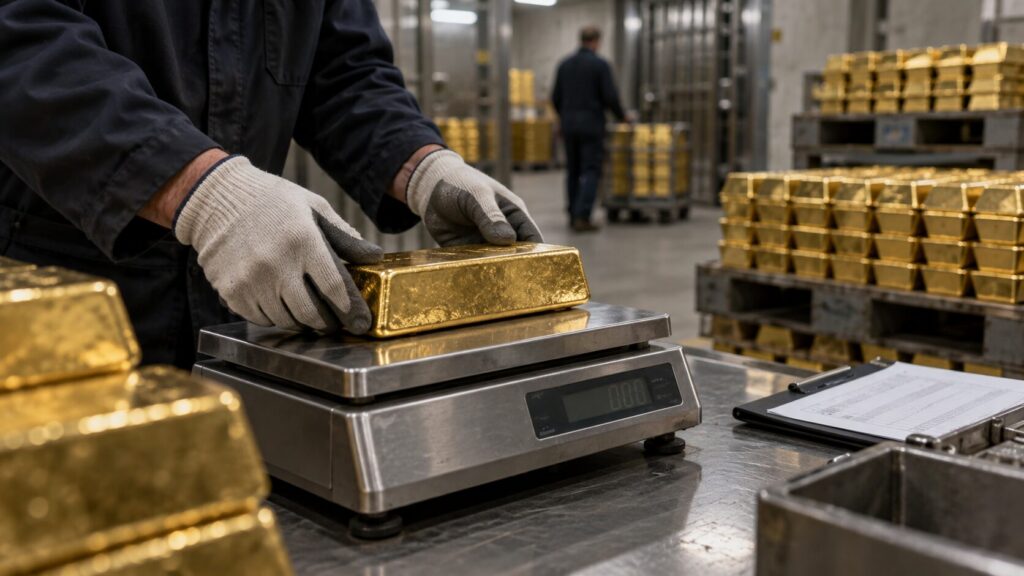
China’s central bank added just 80 tonnes of gold in eight months. So who imported the other 1,000-plus tonnes? A wave of household and institutional buying betting that gold is worth owning now, not later.
How Much Silver Should You Own? A Portfolio Allocation Guide by Age and Goal
There is no Dalio-style institutional rule for silver the way there is for gold. This piece derives one using the live gold-silver ratio, silver’s dual monetary-and-industrial risk profile, and an age-and-goal framework that extends GoldSilver’s own gold-allocation guide.
The Fed Vote Is Already Priced In. These Five Things Aren’t.

Wednesday’s Fed decision is already priced into gold and silver. The real story this week is what’s happening underneath it — a positioning shift, an unreported buying gap, and more.


