 Silver Rises Over 120% YTD




How Much Gold Should You Own at 25, 45, or 65?

How much gold should you own at 25, 45, or 65? The right allocation isn’t a fixed percentage. It moves with your time horizon, income needs, and volatility tolerance, and this decade-by-decade framework shows you how, using the same models Morgan Stanley and Bridgewater actually rely on.
Gold ETFs Just Pulled In $2 Billion. Silver Investors Pulled Out.
Gold ETFs pulled in nearly $2 billion this week even as gold’s price dipped, while silver’s biggest fund saw outflows. Here’s what that paper-positioning split does and doesn’t tell you.
Gold ETF Outflows Came From One Region. The Buying Came From Everywhere Else.
Gold ETF outflows in 2026 were not a market-wide verdict on gold. They came from one region. North America was the only region in net outflow across the first half, while Asia recorded its strongest first half on record. Here is what the regional split says about owning gold in paper form versus physical.
Four “Imminent Collapse” Arguments Are Everywhere Right Now. Here’s What the Data Actually Shows.

National debt, AI valuations, foreclosures, private credit — four separate arguments for an imminent collapse are circulating right now. We checked each one against the primary data. None of them, on the numbers, point to a sudden shock.
Five Things Moved Gold and Silver This Week. Only One Was Kevin Warsh.
Gold and silver fell as Kevin Warsh’s Jackson Hole speech landed today. Four other stories moved gold and silver markets this week for entirely different reasons.
Five Gold Signals Fired This Week. None of Them Are About Today’s Price.

State Street’s outlook, silver’s outperformance, a Fed report, a Treasury buyback, and a fast-growing token all quietly reinforce each other this week. None of it is about today’s price. All of it is about who wants to own the metal, and why.
Australian Gold Kangaroo: The Bullion Coin Backed by an Act of Parliament
Perth Mint’s flagship bullion coin changes its reverse almost every year, which is the least interesting thing about it. At 99.99% purity with an uncapped mintage, the Australian Gold Kangaroo coin sits behind a guarantee written into Western Australian statute in 1987. Here is what that actually means for what you own.
Kiyosaki Gold Prediction: Buy the Dip or Wait?
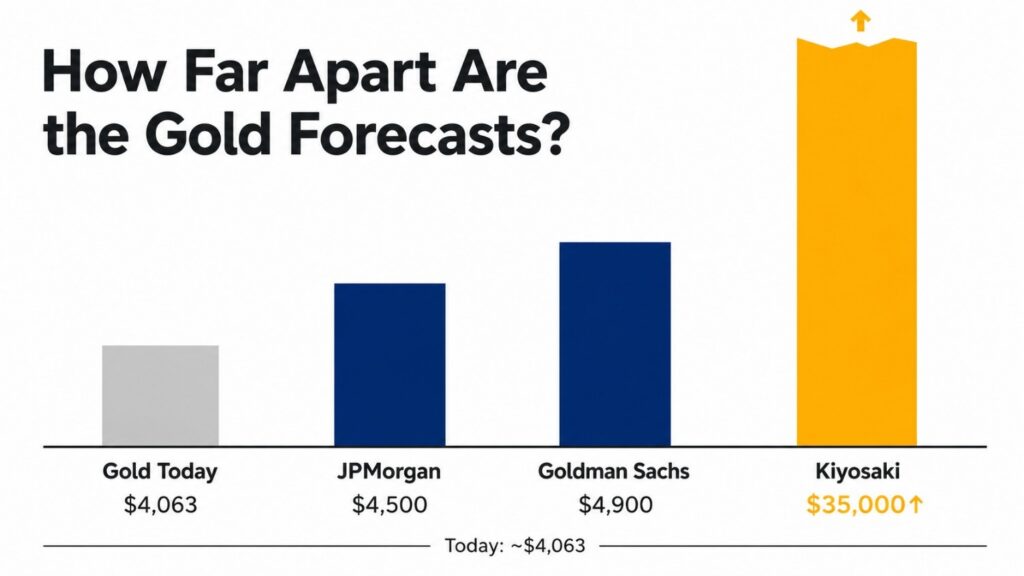
Robert Kiyosaki predicts $35,000 gold after a systemic collapse. Goldman Sachs targets $4,900. JPMorgan targets $4,500. Gold trades at $4,063 today — 27% below its all-time high. Here’s what the structural data says about buying the dip or waiting.
Oil Spiked 7% Yesterday. Silver Sold Off. Today Physical Buyers Are Doing Something Different.
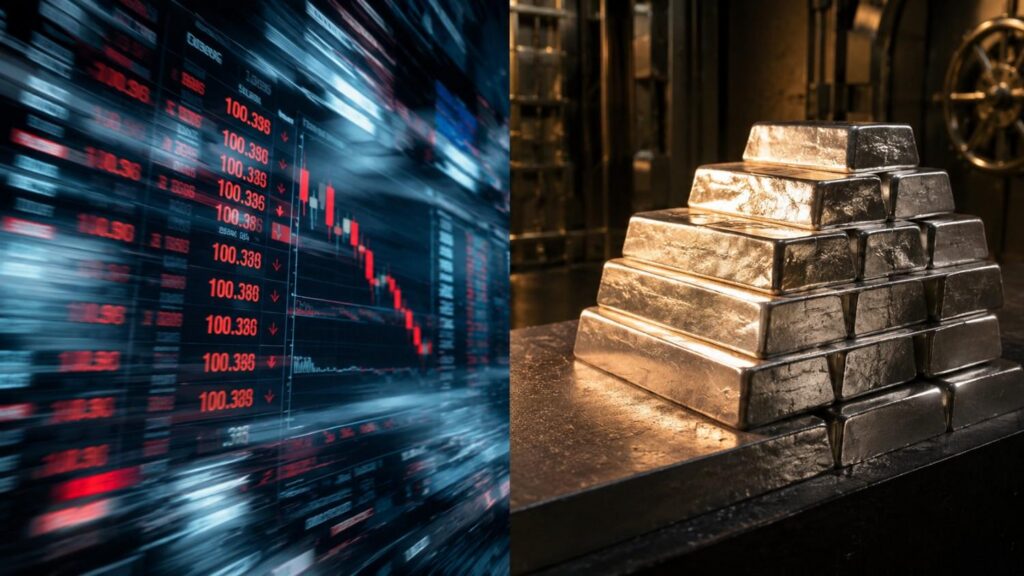
Silver recovered on Friday, July 24, 2026, after falling roughly 3% the prior session when Brent crude surged 7% above $100. Brent retreated below $100 on Friday as physical buyers stepped back in ahead of the July FOMC meeting. Here is the mechanism — and what the paper-vs-physical divergence tells you about where silver goes next.
What Are the Best Physical Precious Metals Products to Buy During a Correction?
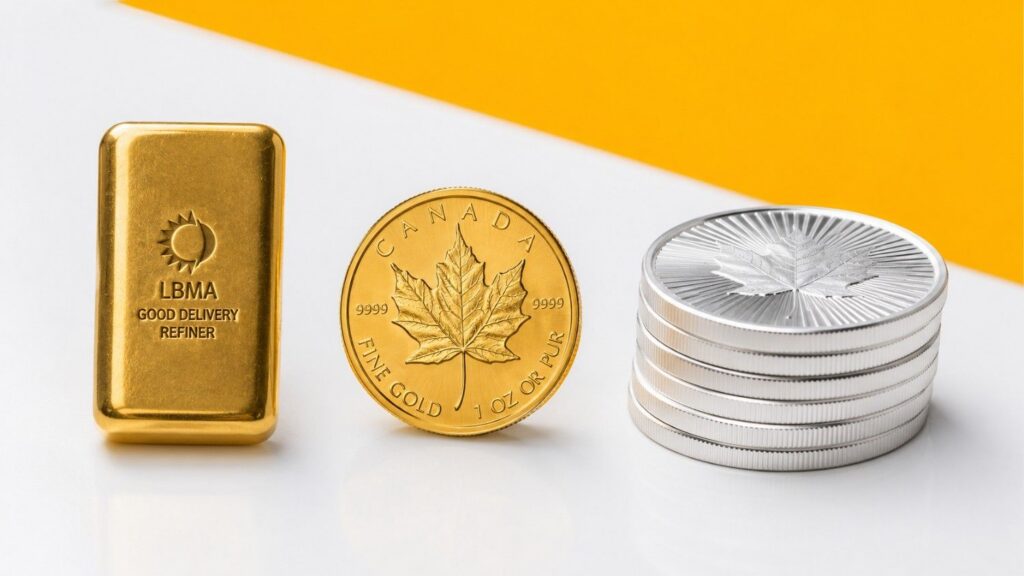
A correction creates buying opportunity — but only if you choose the right product. Here is which physical formats minimize premiums and deliver the most metal per dollar when prices dip.


