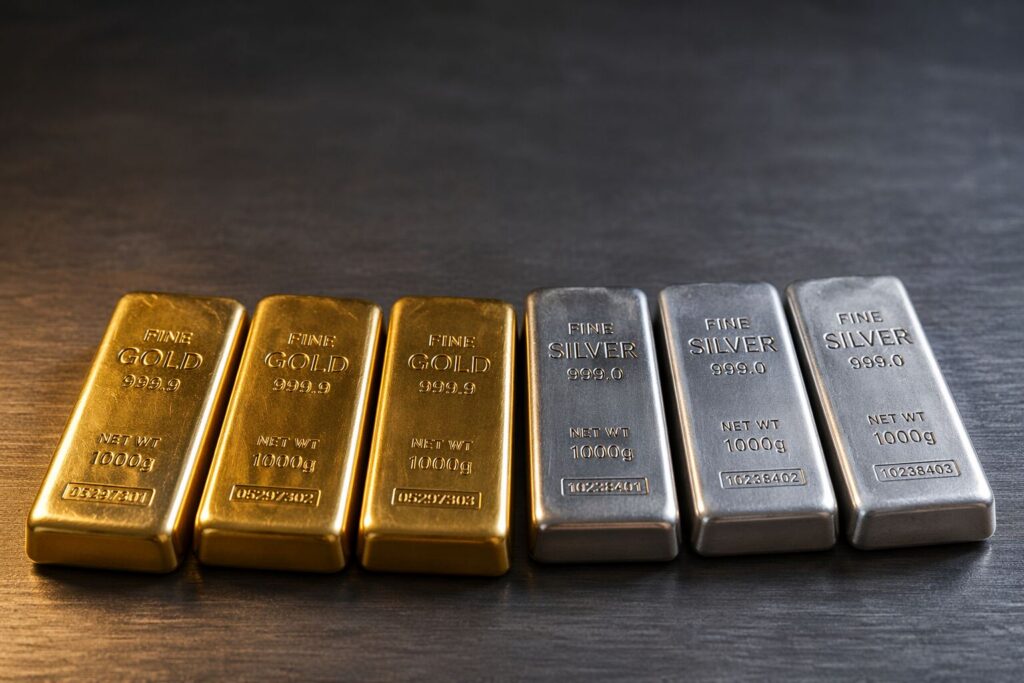
BRICS Is Hoarding Gold. Here’s What It Means for Your Portfolio.
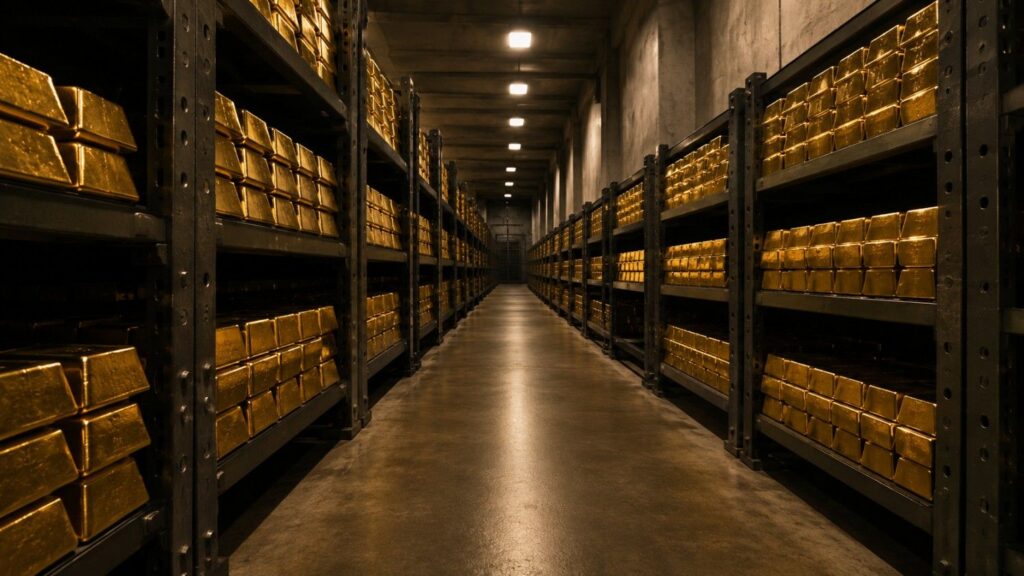
Central banks are buying gold at near-record pace. BRICS+ nations are building a monetary alternative. Most investors are the last to hear about it — and the last to position. Here’s the mechanism, the portfolio logic, and what to actually do about it.
Dollar-Cost Averaging Into Gold and Silver: The Investor’s Practical Guide

Most investors who want to own gold and silver never build the position they intend — not because the strategy is wrong, but because they keep waiting for the perfect moment to buy. Dollar-cost averaging solves that problem. This guide explains the mechanism, shows the math, and gives you a practical plan to build a precious metals position systematically — without needing to predict prices.
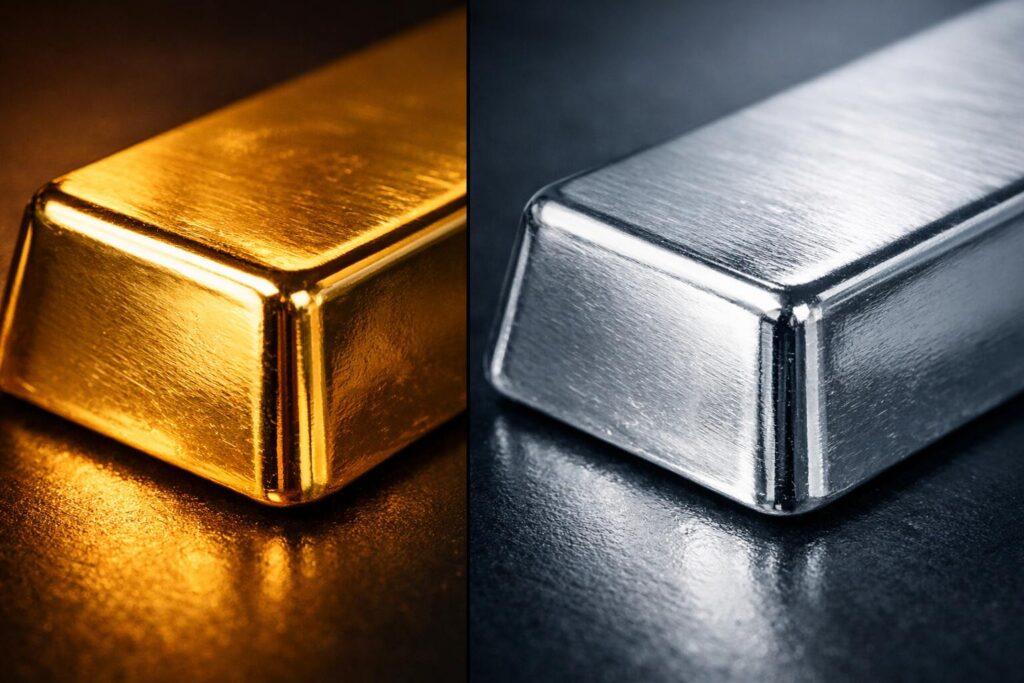
Silver vs. Gold: A Clear 5-Year Investment Guide (2026–2031)

Gold has crossed $5,000. Silver has broken $100. With precious metals at historic highs, the silver vs gold investment debate has never been more relevant. This guide breaks down risk profiles, industrial demand, price forecasts, and portfolio allocation strategies to help you decide how to position your precious metals holdings for 2026–2031.
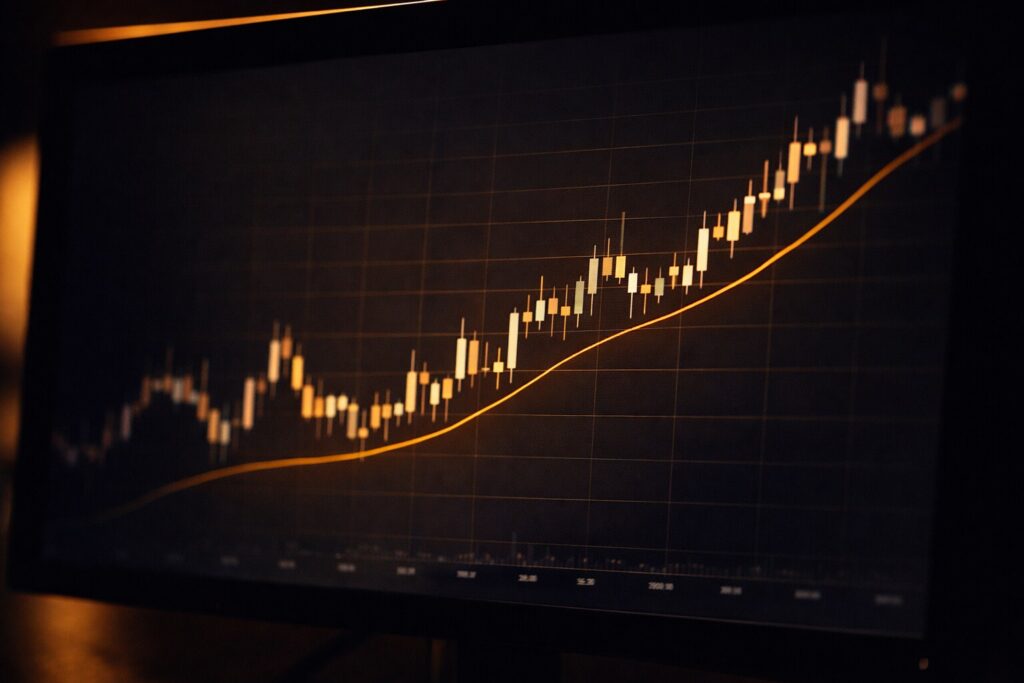
Gold or Silver Price Dip: Temporary Correction or Trend Reversal?
When gold or silver prices fall, the real question isn’t how far — it’s why. Learn how to read a price dip, spot the difference between a healthy correction and a genuine trend reversal, and respond with a strategy instead of emotion.
Why Silver Falls While Gold Rises: What It Means for You
Gold and silver often move in opposite directions — and most investors don’t know why. This piece breaks down the real reason behind the divergence, how the gold-to-silver ratio signals opportunity, and what it means for your allocation strategy.
What the Silver-to-CPI Ratio Reveals That Spot Price Hides
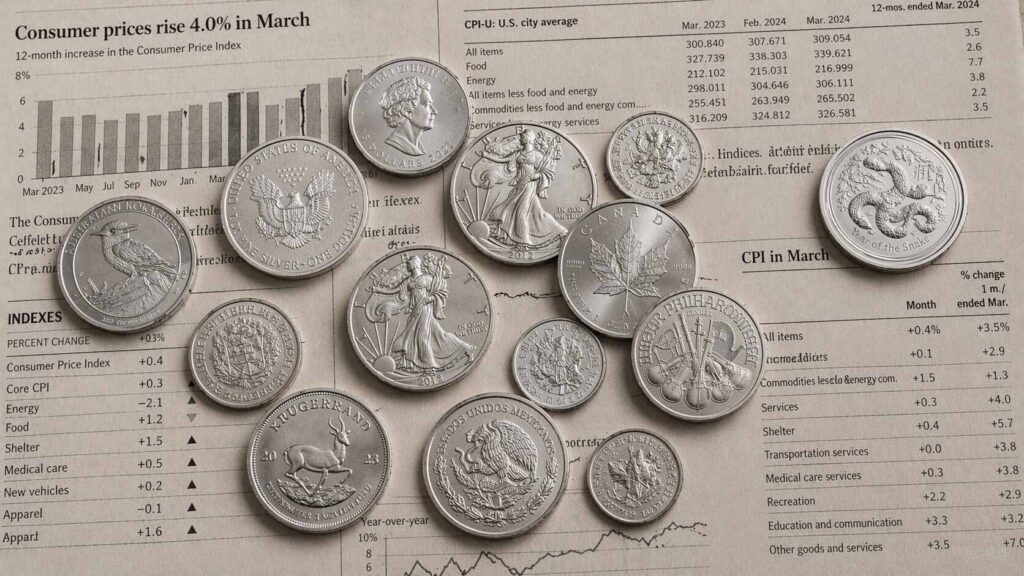
Silver hit a nominal all-time high of $121.64 in January 2026 — yet the silver-to-CPI ratio tells a different story. Adjusted for inflation, silver remains well below its 1980 peak and barely above its 2011 cycle high. Here’s what the ratio reveals that spot price alone never can.
Gold & Silver Supply and Demand: What Really Drives Prices Over Time
Gold and silver prices don’t move by chance. Discover the key supply and demand forces — from central bank activity and real interest rates to silver’s growing industrial role in solar and EVs — that drive precious metals prices over time and what they mean for your portfolio.
How the 50 Day SMA Helps You Understand Gold & Silver
The 50-day SMA is one of the most reliable tools for reading gold and silver price trends. Learn how to use it to identify support levels, spot momentum shifts, and make more confident precious metals investment decisions.
Gold Silver Ratio Forecast (75): Buy Gold, Add Silver, or Wait?
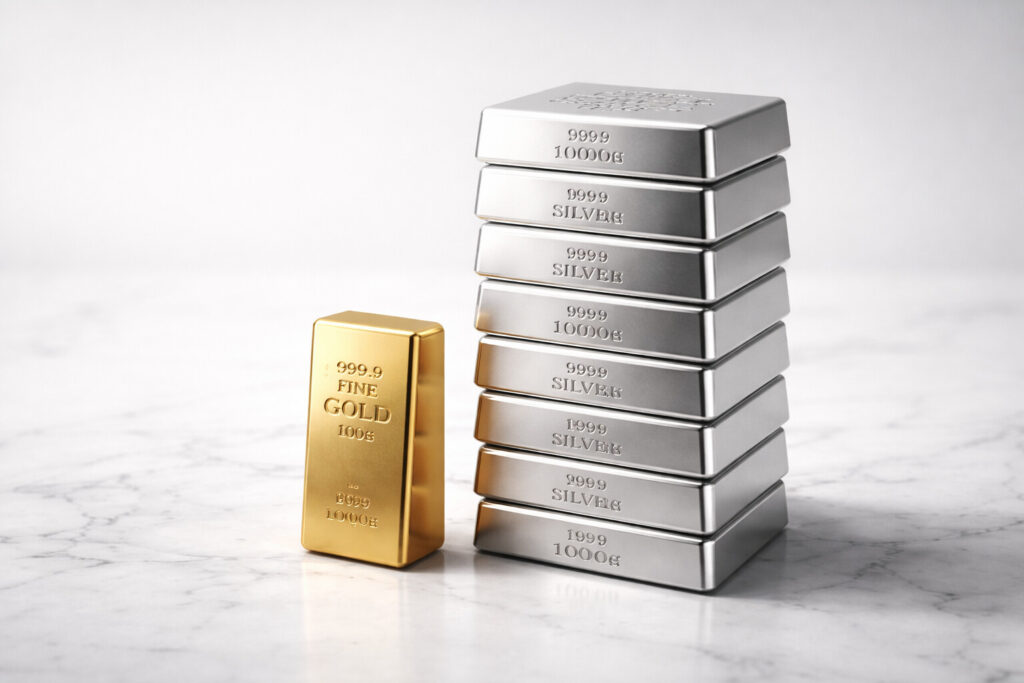
A gold-silver ratio of 75 signals silver is historically undervalued relative to gold. Discover what the data says, which metals to buy, and how to allocate your precious metals portfolio with confidence.
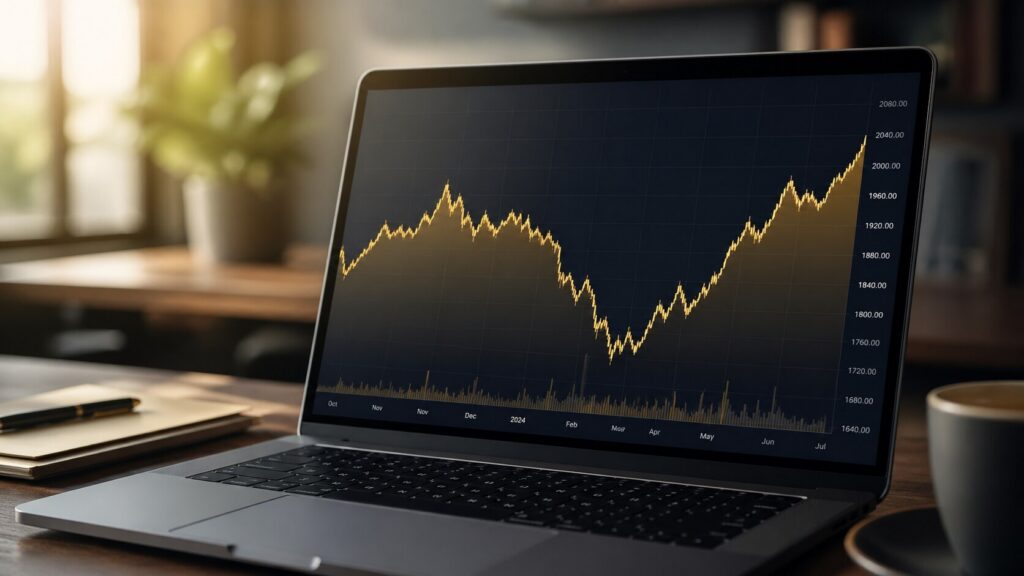
Gold Price Forecasts for 2026, Revisited After Q1

Gold prices are shaped by powerful forces — real interest rates, U.S. dollar strength, central bank demand, and geopolitical risk. This guide breaks down the key drivers behind gold future prediction, reviews a decade of historical performance, and outlines what investors should watch heading into 2026.
