 Silver Rises Over 120% YTD




Gold Is Down 26%. Silver Is Down 51%. What Does the Stacker Do Now?
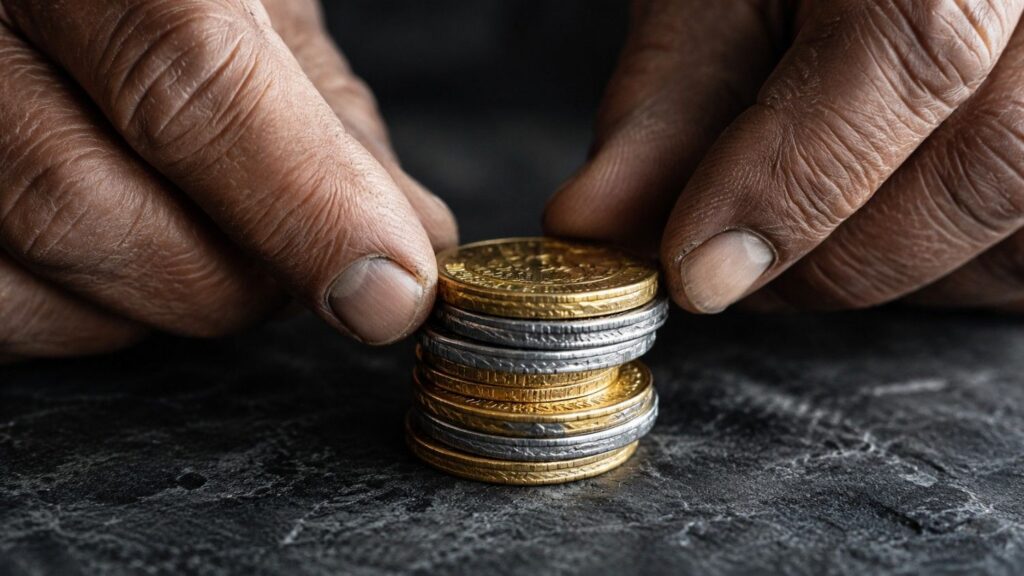
Gold and silver have pulled back sharply from their January 2026 peaks. The structural case — six consecutive silver deficits, 863 tonnes of central bank gold buying, and a gold-silver ratio above its long-run average — has not changed. This guide covers the floor thesis, how to read the GSR as a strategic compass, and how dollar-cost averaging turns volatility into an advantage.
Why the 10-5-3 Rule Fails Gold and Silver Investors
Excerpt:
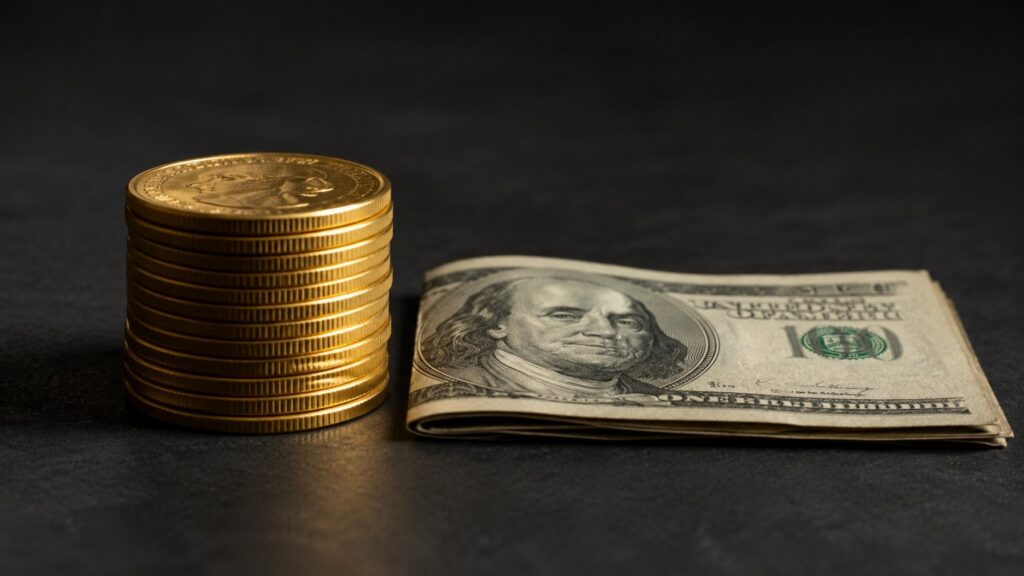
The 10-5-3 rule helps investors set return expectations for stocks, bonds, and cash. But gold and silver aren’t paper assets — and measuring them with a framework built for yield and earnings leads to the wrong conclusions every time. Here’s what precious metals investors use instead.
Why Does Silver Drop Before Options Expiration? The Monthly Pattern David Morgan Calls “Courtroom-Level Proof”

Silver drops near options expiration every month — not because of fundamentals, but because of a paper-market mechanism called delta hedging. David Morgan explains how it works, why it’s recurring, and why the structural case for silver remains completely intact.
The Silver-to-Dow Ratio: How to Spot the Shift from Paper to Physical
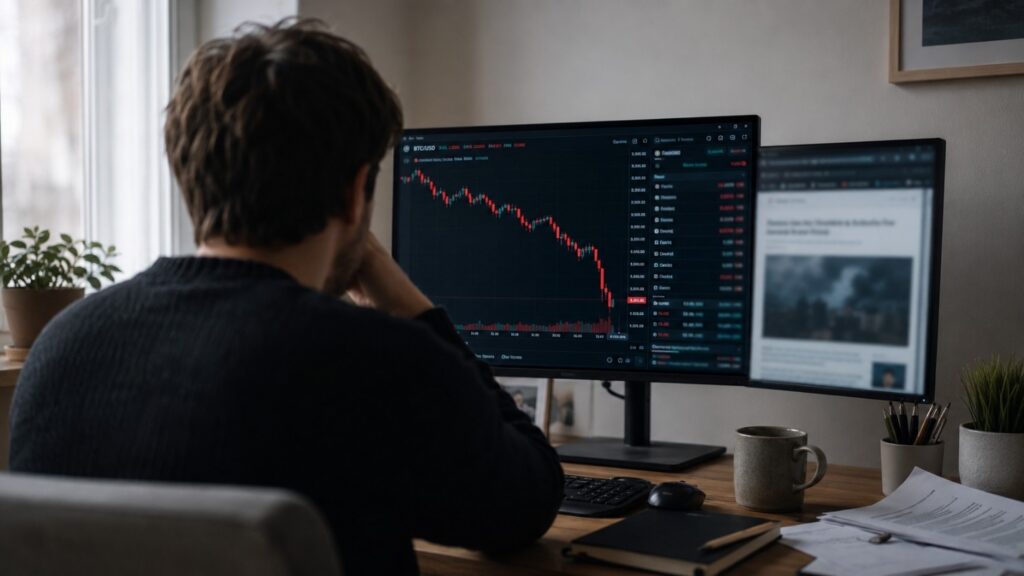
Silver dropped ~10% after the Trump-Xi summit ended without a deal. The silver-to-Dow ratio — how many ounces it takes to buy the Dow — sits near 659 today. In 1980, it took just 18. That gap is the whole argument.
Silver Price Predictions for the Next 5 Years: Data-Backed Scenarios
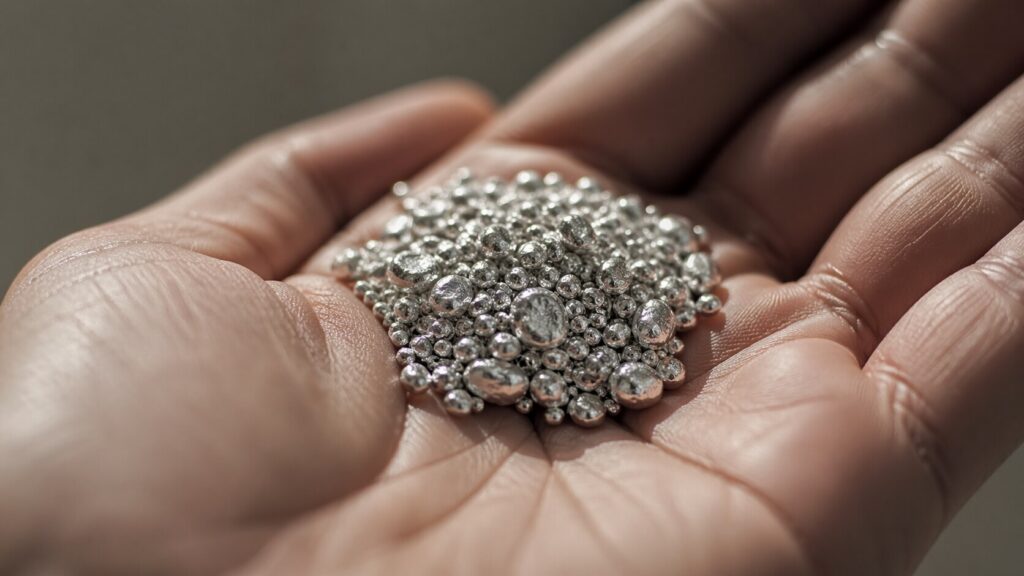
Silver currently trades around $80 per ounce after pulling back from its January 2026 all-time high. For the next five years, the data points to a range of $90–$200+ depending on how industrial demand, supply deficits, and monetary conditions evolve. Here are three data-backed scenarios — and exactly what to watch.
Silver Price Forecast 2026-2027: The bull case and bear case laid out
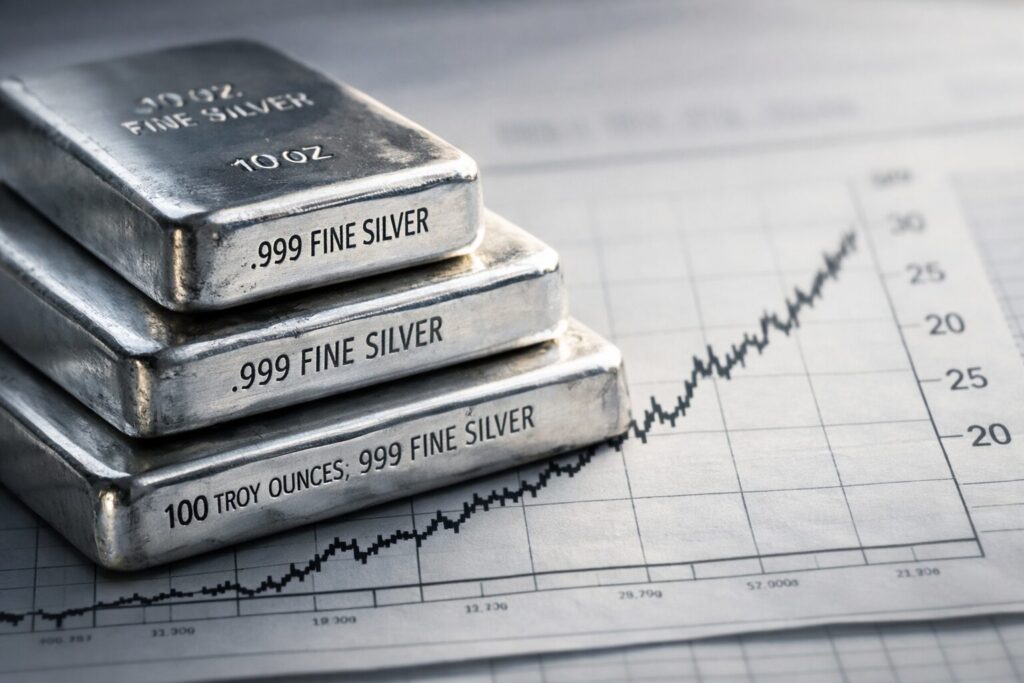
Silver surged 147% in 2025 and hit an all-time high of $121/oz in January 2026. But what comes next? This analysis breaks down the bull and bear case for silver prices in 2026–2027 — covering supply deficits, industrial demand, Fed policy, and institutional forecasts from J.P. Morgan, Commerzbank, and more — so you can make a more informed decision about your precious metals strategy.
Silver broke a historic record. The bigger signal isn’t the price.

Silver’s price is getting all the attention. But COMEX inventory drawdowns, a historic 10-month closing streak, and a Bank of America forecast ranging from $135 to $309 suggest the bigger story is happening beneath the surface.
The 1970s Gold & Silver Bull Run: Causes, Returns, and Lessons for Investors
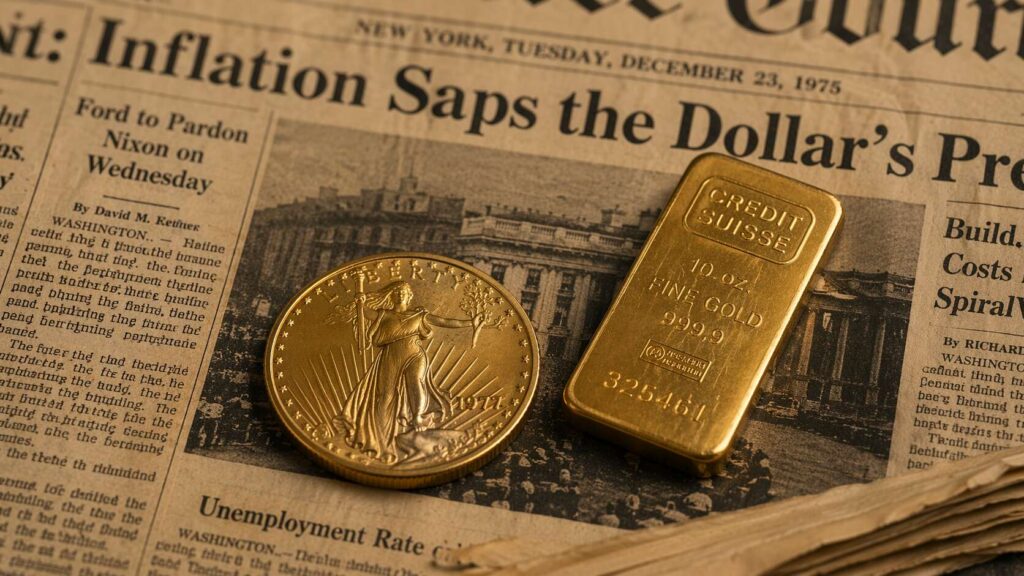
The 1970s gold and silver bull run remains one of the most dramatic wealth events of the 20th century. Gold rose 2,300%. Silver gained 400% in a single year. Understanding what drove that decade-long move — and what finally ended it — gives modern investors a precise framework for reading today’s precious metals market.
What the Silver-to-CPI Ratio Reveals That Spot Price Hides
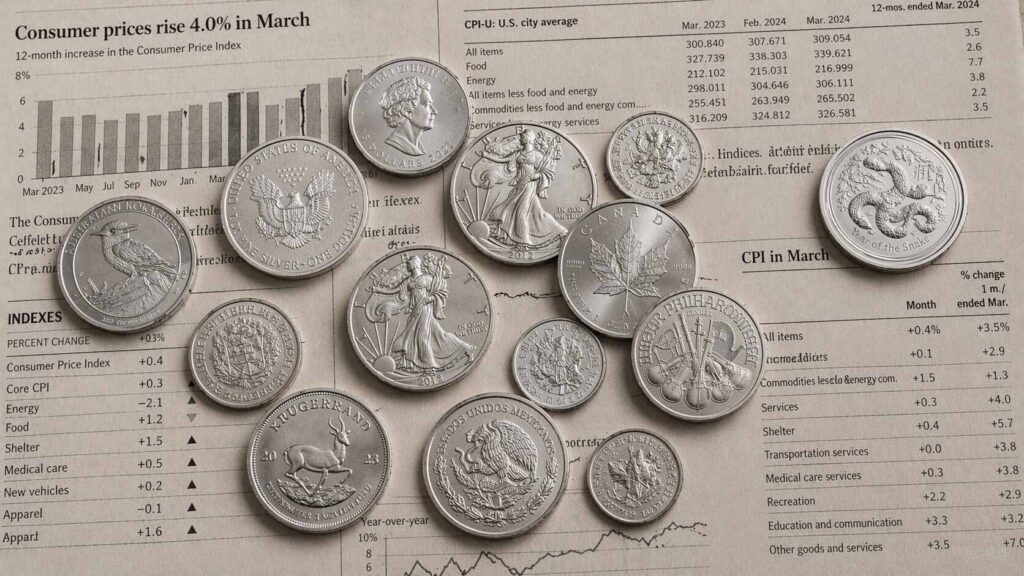
Silver hit a nominal all-time high of $121.64 in January 2026 — yet the silver-to-CPI ratio tells a different story. Adjusted for inflation, silver remains well below its 1980 peak and barely above its 2011 cycle high. Here’s what the ratio reveals that spot price alone never can.
The Ounce Mindset: Why Silver’s Pullback is a Gift
Silver hit an all-time high of ~$121 in January 2026 and has since pulled back to the mid-$70s. Mike Maloney’s framework for why that’s an opportunity, not a loss — and how to measure wealth in ounces, not dollars.


