 Silver Rises Over 120% YTD




How to Time Your Gold & Silver Buys Using Technical Analysis
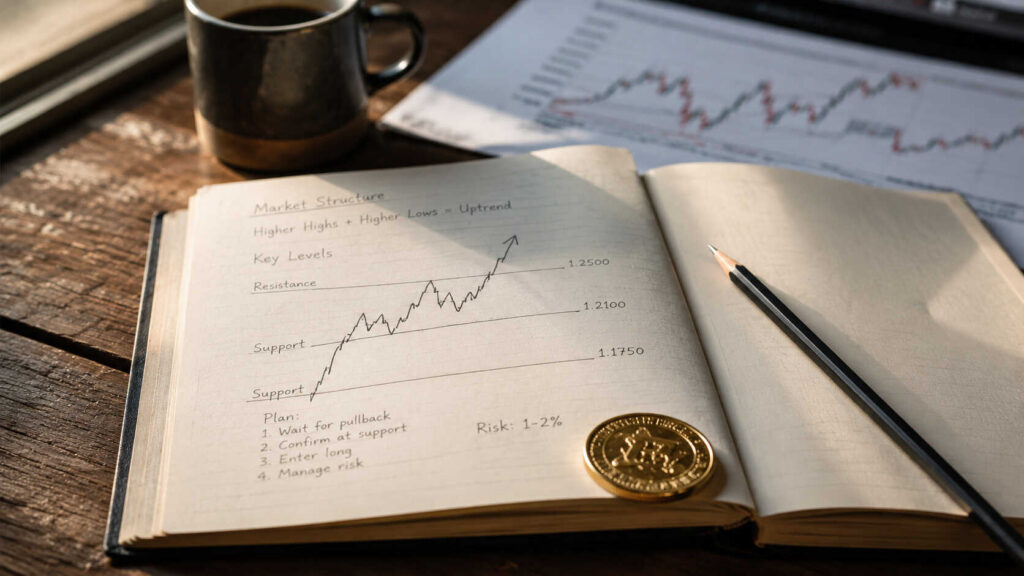
Gold has pulled back roughly 16% from its January 2026 all-time high of $5,589. For long-term stackers, understanding support levels, moving averages, RSI, and the gold-silver ratio can mean meaningfully more ounces per dollar over time.
Silver Jewelry or Bullion? A Buyer’s Guide to the Real Difference
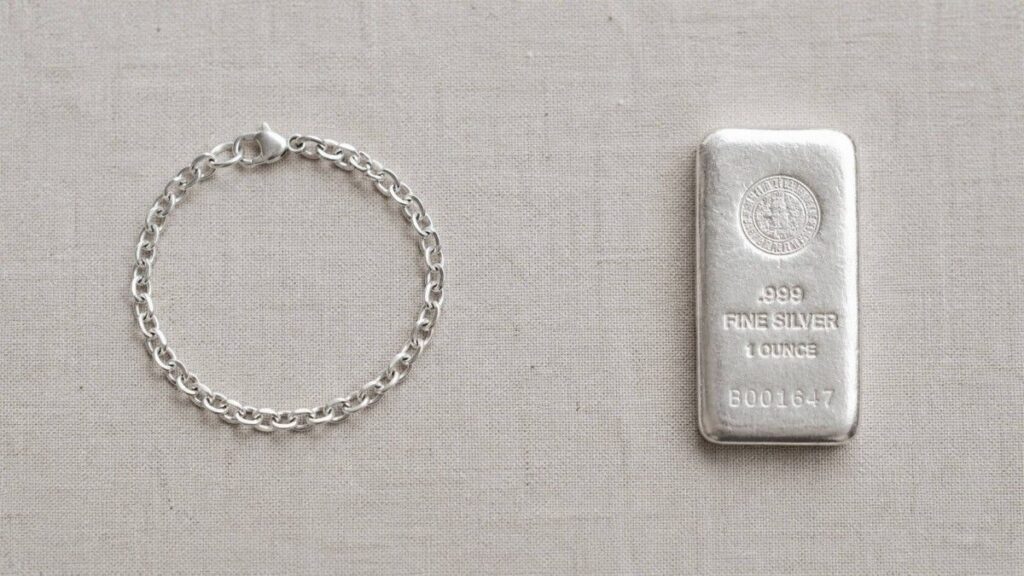
Silver hit an all-time high of $121.67 in January 2026, yet many buyers still overpay for silver jewelry when bullion would serve them far better. Here’s how to tell the difference — and why it matters for your wallet.
Silver Bullion Buying Guide 2026: Coins, Bars, and Rounds Compared
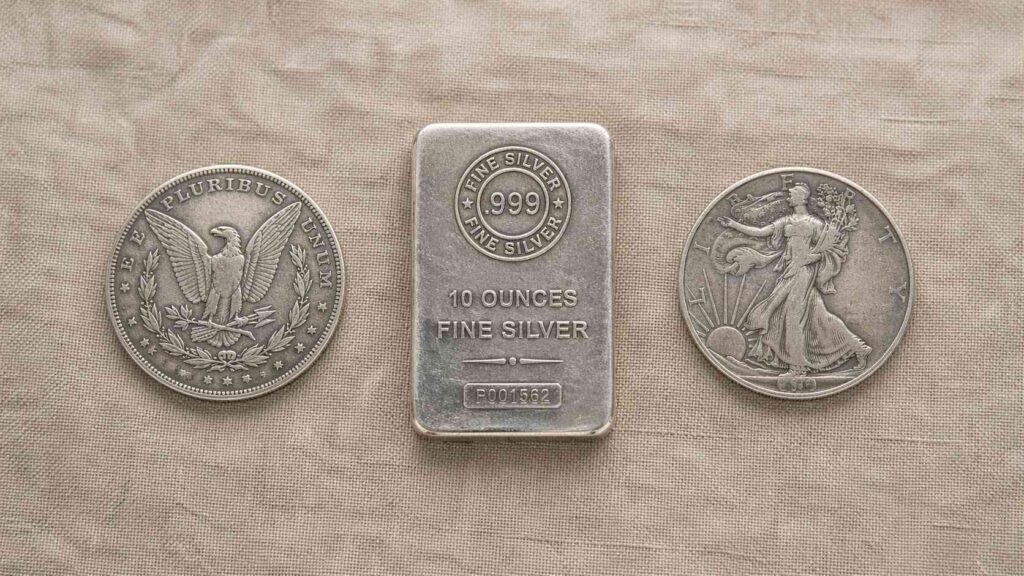
Silver hit an all-time high of $121.64 in January 2026 and has since pulled back 34%. Before you buy, here’s how coins, bars, and rounds compare on premiums, liquidity, and IRA eligibility.
Silver Price Forecast 2026-2027: The bull case and bear case laid out
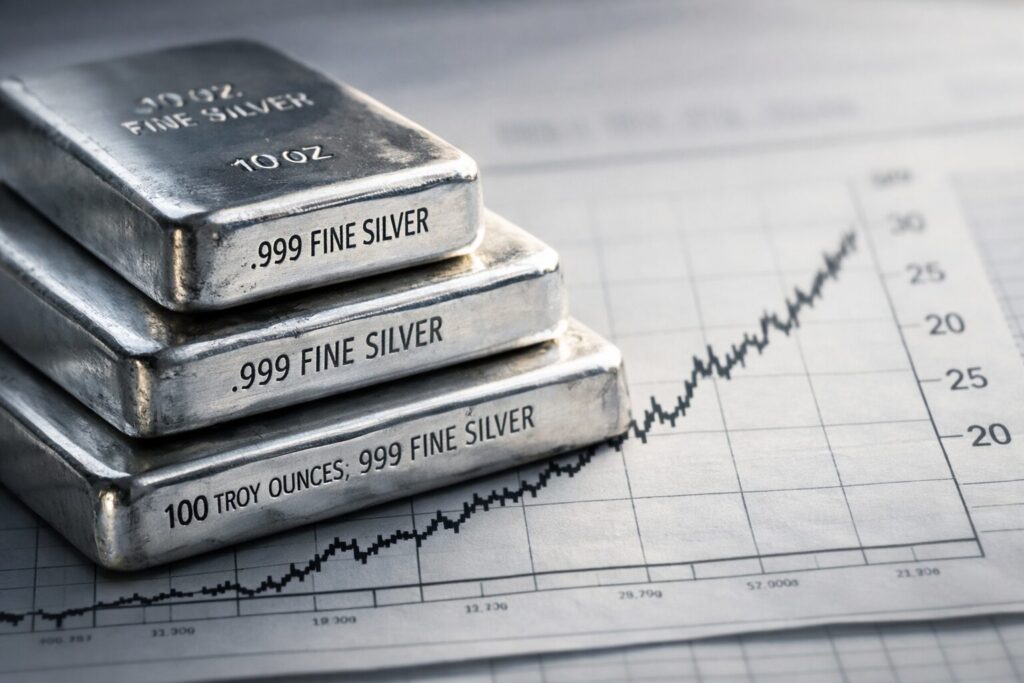
Silver surged 147% in 2025 and hit an all-time high of $121/oz in January 2026. But what comes next? This analysis breaks down the bull and bear case for silver prices in 2026–2027 — covering supply deficits, industrial demand, Fed policy, and institutional forecasts from J.P. Morgan, Commerzbank, and more — so you can make a more informed decision about your precious metals strategy.
What the Silver-to-CPI Ratio Reveals That Spot Price Hides
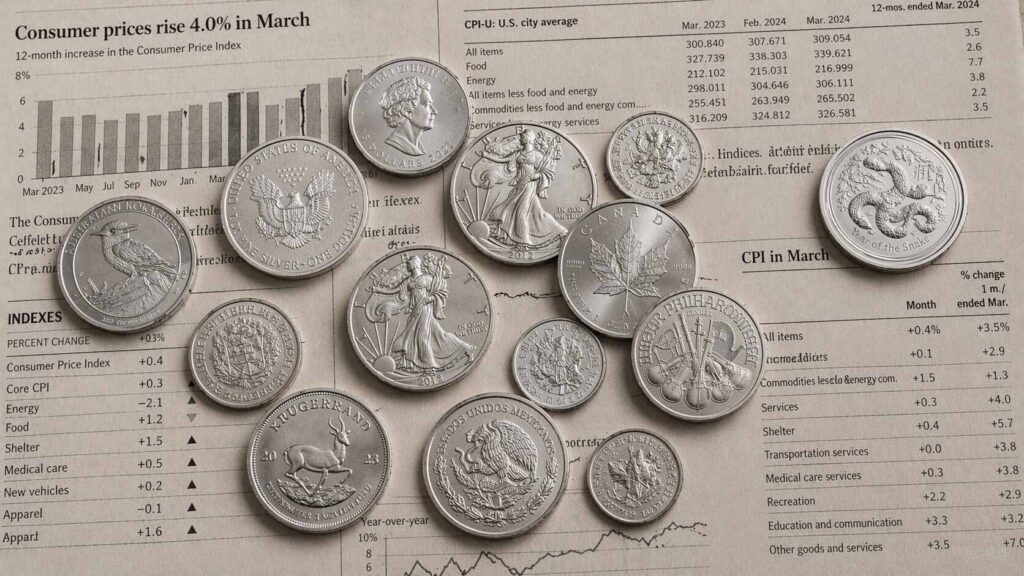
Silver hit a nominal all-time high of $121.64 in January 2026 — yet the silver-to-CPI ratio tells a different story. Adjusted for inflation, silver remains well below its 1980 peak and barely above its 2011 cycle high. Here’s what the ratio reveals that spot price alone never can.
Numismatic vs. Bullion Coins: Know What You’re Buying
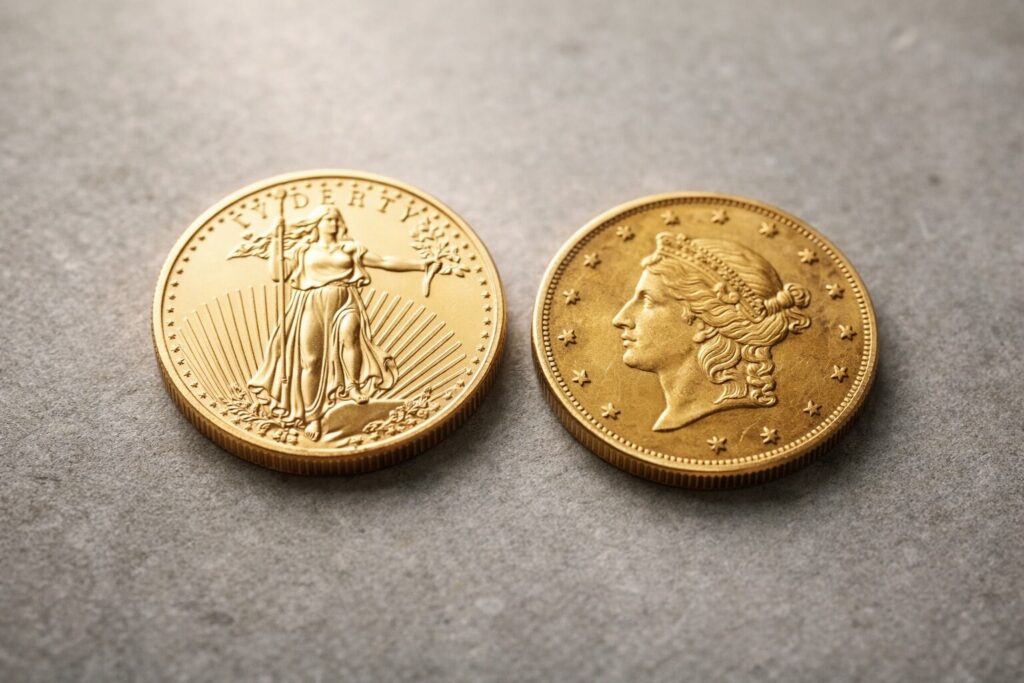
Not all gold and silver coins are created equal. The numismatic vs. bullion coins decision shapes what you pay, how easily you can sell, and how directly your investment tracks the metal itself. Here’s a clear breakdown of both — and what belongs in a serious portfolio.
Why Is Gold Falling When the World Is on Fire?
Why is gold falling when the world is on fire? This piece breaks down the five forces behind the selloff: Iran’s oil shock, the March jobs surprise, the Fed’s stagflation trap, Goldman’s $5,400 gold thesis, and whether the safe-haven story is broken or just deferred.
Gold Silver Prices: Short-Term Noise, Long-Term Signal
Gold and silver prices are full of short-term noise—daily swings driven by Fed commentary, currency moves, and speculative trading. But underneath the volatility lies a consistent long-term signal. Learn how to tell the difference, what structural forces actually drive precious metals prices over time, and how to build a strategy that stays focused on what matters most.
Silver Price Components: Premium, Spot, and Dealer Markup Explained
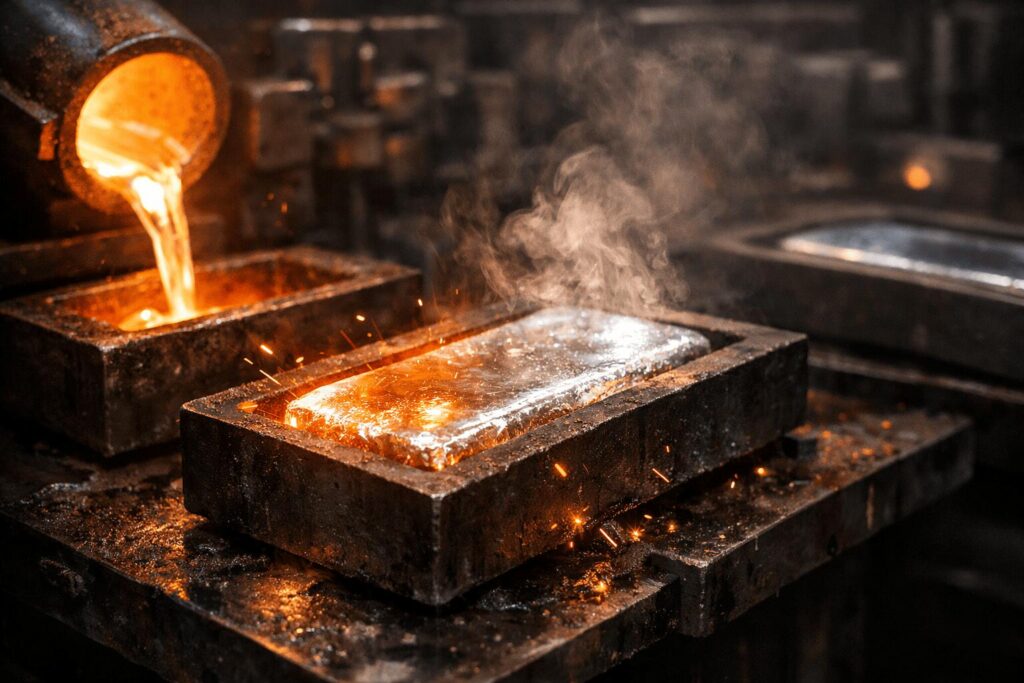
If you’ve ever wondered why physical silver trades above the spot price, the answer lies in how silver is priced. This article breaks down silver price components—spot, premiums, and dealer markup—and explains why bid/ask spreads widen during periods of high prices, tight credit, and refining bottlenecks.
How to Get the Best Price When Selling Gold or Silver
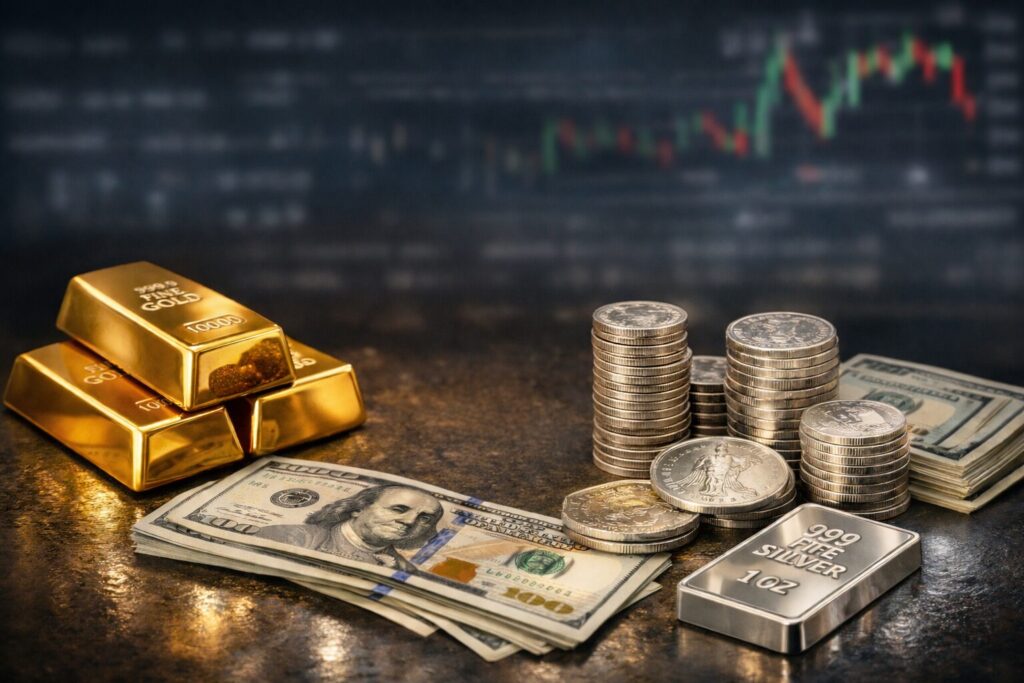
Selling gold and silver doesn’t have to be complicated. This guide shows you how to get the best price, avoid common pitfalls, and choose the safest, most transparent way to convert your metals into cash.


