Silver Rises Over 120% YTD


Gold Technical Analysis: A Complete Investor’s Guide
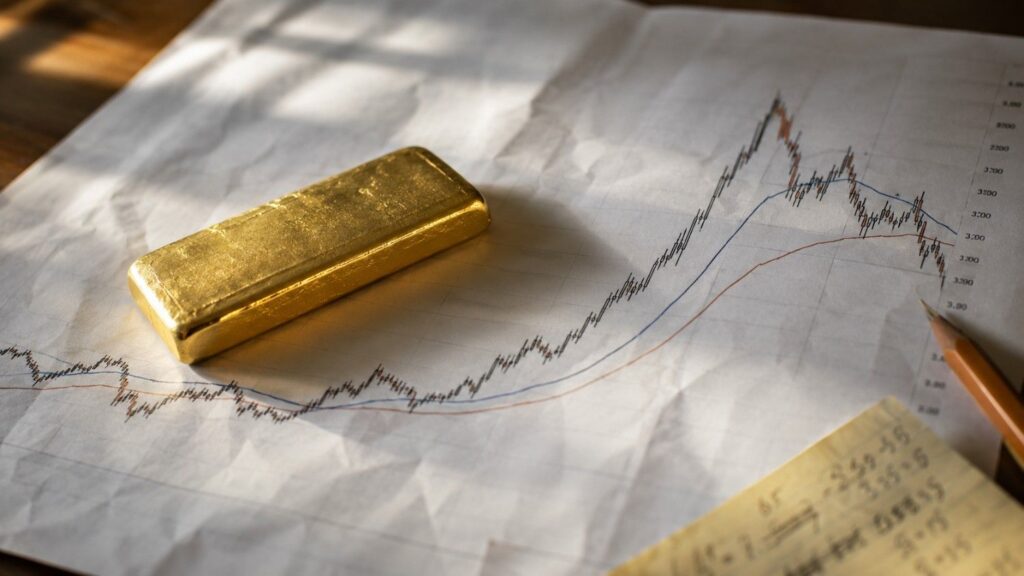
Gold technical analysis explains how moving averages, RSI, MACD, and Fibonacci retracement levels work — and how long-term physical holders can use them to size positions and time entries more intelligently.
The Anatomy of a Premium: Why Gold and Silver Never Trade at Spot

You’ll never buy gold or silver at the spot price you see quoted. Here’s exactly where every extra dollar goes, and why that gap widens when the market tightens.
Warsh Called Inflation “Too High.” He Also Said the Risk Is Fading. Gold Noticed.

Gold and silver jumped Wednesday after Fed Chair Kevin Warsh softened his hawkish tone at the ECB’s Sintra forum — a shift that matters more than the day’s ADP miss. Here’s the real-yield mechanism behind the move, and why Thursday’s early jobs report is now the number to watch.
Most Gold Storage Isn’t Allocated. How to Check Yours.

Most gold storage isn’t allocated. Here’s how to verify yours is — and the three questions every gold owner should ask their storage provider.
Garner Calls a $3,600 Floor. Is Gold Going Lower?

Gold hit an all-time high of $5,589 on January 28, 2026. It is trading around $4,024 today. A new Fed Chair is explicitly trying to reverse the monetary policy trend that drove it there. Here is whether that changes anything for long-term holders.
OCBC Just Cut Its Gold Forecast by $740. The Reason Is the Story.

OCBC cut its year-end gold target by $740 this morning — from $5,100 to $4,360. The mechanism behind the cut is the entire story of this correction. And it’s the same mechanism physical metal holders bought protection against.
Mining Margins Beat Google’s. Here’s What That Tells You About Gold.

At $4,000 gold and $60 silver, the companies pulling this metal out of the ground are generating margins that rival the most profitable technology businesses on earth. Precious metals investor Tavi Costa explains the mechanism — and what it means for long-term owners of physical gold and silver.
Gold Is Closing Its Worst Quarter Since 2013. A War Made It Happen.
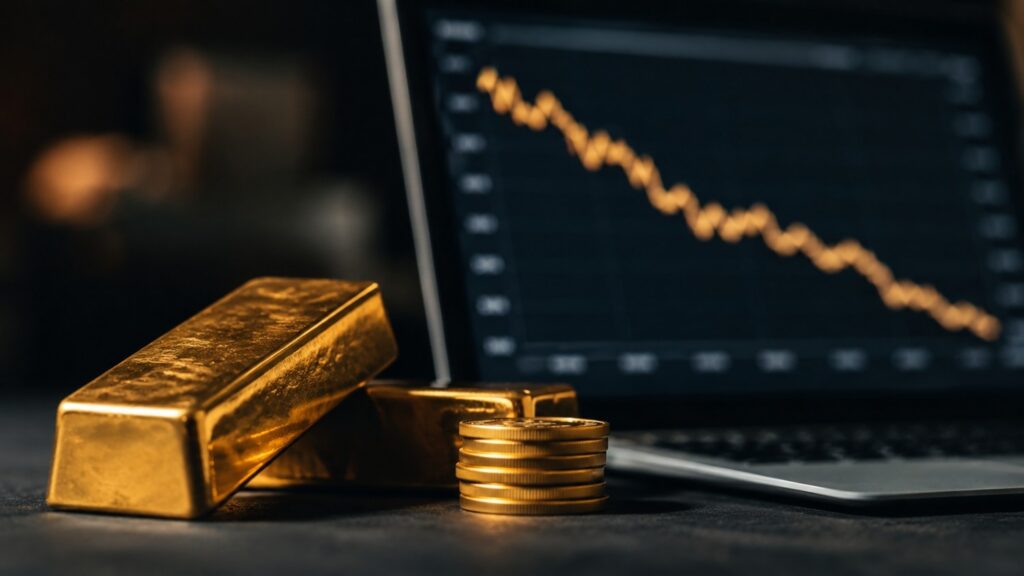
Gold entered Q2 at around $4,700. It is leaving at $4,015. That is the worst quarterly decline since the 2013 taper tantrum — and the cause is a war, not despite one.
Why Is Gold So Expensive? The 5 Mechanisms Behind the Price
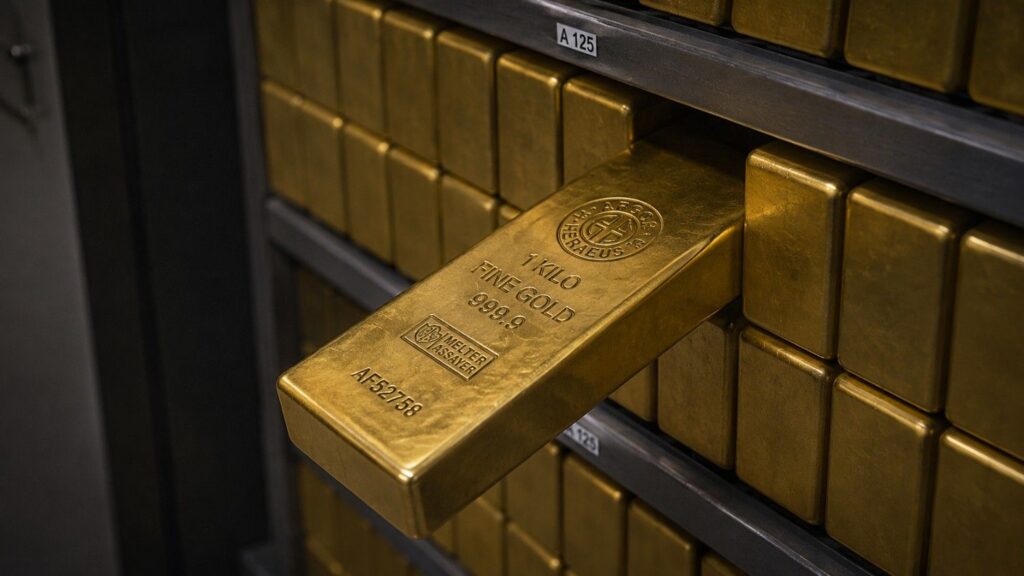
Gold costs roughly $4,000 per ounce today. Here are the five specific, measurable forces that explain exactly why — and why every major bank expects the price to go higher.
Gold vs. Savings Account: Which One Is Actually Beating Inflation Right Now?

With inflation at 4.2% and the national average savings rate at 0.38%, your savings account is earning a real return of approximately negative 3.8% per year. This article explains what a savings account and gold each actually do — and which one is built for the job of protecting your purchasing power over the long term.