Published: 06-29-2026, 04:18 pm
Key Takeaways
- Gold’s total above-ground supply — about 220,000 tonnes, all of it — fits in a cube 22 meters on each side [World Gold Council, 2025]. Annual new supply grows at roughly 1.8% per year and cannot be accelerated.
- Gold’s zero nominal yield becomes competitive when real interest rates compress toward zero. PIMCO’s regression of 2004–2025 data shows a 100-basis-point real yield increase has historically corresponded to an 18% decline in the inflation-adjusted gold price [PIMCO].
- Central banks purchased more than 1,000 tonnes of gold per year from 2022 through 2024 — double the prior decade’s pace — and 863 tonnes in 2025, still nearly double the pre-2022 average [World Gold Council, Full Year 2025]. This structural demand raised the price floor in a way the traditional real yield model did not anticipate.
- A weakening US dollar mechanically increases gold demand from every non-US buyer simultaneously. Goldman Sachs calculates that every 50 basis points of Fed easing adds about $120 per ounce of gold price support [Goldman Sachs Global Investment Research, June 2026].
- As of June 2026, Goldman Sachs forecasts gold at $4,900 per ounce by year-end, JPMorgan at $6,000, and Wells Fargo at $6,100–$6,300 — all significantly above current levels [GoldSilver, Gold Price Forecast 2026].
Five forces make gold expensive: physical scarcity, real interest rate competition, central bank structural buying, US dollar mechanics, and monetary debasement. Each reinforces the others. Together, they drove gold to an all-time high of $5,589 per ounce on January 28, 2026.
Gold is expensive because its total supply is vanishingly small relative to global demand. It competes directly with government bonds — but only when you measure the right thing. Central banks worldwide bought more than 1,000 tonnes per year from 2022 through 2024. That is roughly double their prior decade’s pace. It created a structural price floor that did not exist before [World Gold Council, 2025].
Most investors searching for why gold is so expensive find the real mechanisms surprising. At roughly $4,000 per ounce in June 2026, gold sits 28% below its January 2026 peak. Yet it remains near its highest inflation-adjusted levels in modern history. Every major bank from Goldman Sachs to JPMorgan forecasts the price will trade significantly higher before year-end. Understanding why starts with one number that most people have never heard.
How Much Gold Actually Exists in the World?
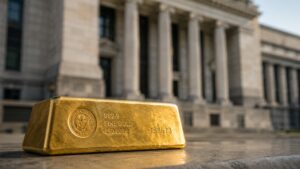
Every ounce of gold ever mined totals about 220,000 tonnes [World Gold Council, end-2025 estimate]. Melted into a single cube, that is roughly 22 meters on each side. That is the height of a six-story building. All of it — every bar, coin, and ingot — represents five thousand years of human effort.
That sounds like a lot. It is not. New supply arrives slowly. Global mine production reached a record 3,672 tonnes in 2025 [World Gold Council, Gold Demand Trends Full Year 2025]. That is roughly a 1.8% annual increase in the world’s total gold stock — a rate the Federal Reserve can exceed in a single afternoon by adjusting the money supply. Gold’s supply constraint is permanent: no amount of capital or technology can meaningfully accelerate the geological process that creates it.
When demand increases for an asset whose supply grows at under 2% per year, the price has to rise. The question is what is currently driving that demand.
The Knowledge That Changes Everything
Two essential guides — yours free. Understand why gold matters and why fiat currencies always fail.
Why Does Gold Have No Yield — and Why Does That Actually Help It?
Gold pays no interest, no dividend, and no coupon. But that zero-yield characteristic works in gold’s favor — if you compare it to the right thing.
Most investors instinctively compare gold to a Treasury bond paying 4% or 5% in nominal terms and conclude gold loses. That comparison is wrong. The correct comparison is gold versus real yields — what a bond actually pays after inflation erodes its purchasing power. That number is tracked by the 10-year TIPS yield. When it falls toward zero or turns negative, bonds are no longer preserving purchasing power. In that environment, gold’s zero yield becomes competitive. It preserves purchasing power instead of destroying it.
PIMCO’s analysis of 2004–2025 data shows a clear pattern: a 100-basis-point rise in 10-year real yields corresponds to an 18% drop in the inflation-adjusted gold price [PIMCO, Understanding Gold Prices]. The Fed’s near-zero rate policy after the 2008 financial crisis sent real yields deeply negative. Gold responded: it climbed from roughly $250 per ounce in 2001 to over $1,900 in 2011. For a closer look at how this relationship works, see our breakdown of gold prices and real interest rates.
Since 2022, however, something unusual happened. Real yields rose sharply. The 10-year TIPS yield climbed to around 2% by mid-2026 — a level that historically suppresses gold prices. Yet gold reached all-time highs. The real yield model did not break down. A second, structurally larger force overrode it.
Why Are Central Banks Buying Gold at Record Rates?
Central banks bought more than 1,000 tonnes of gold per year from 2022 through 2024. That is nearly double the prior decade’s pace — the single most important structural shift in the gold market in decades [World Gold Council, Central Banks Full Year 2025].
The scale matters. Annual global mine production is about 3,600 tonnes [World Gold Council, Gold Demand Trends Full Year 2025]. At peak buying, central banks alone were absorbing roughly 30% of all newly mined gold — before any retail buyer, ETF, or jeweler got a turn. In 2025, buying moderated to 863 tonnes as record-high prices prompted caution. But it still represents nearly double the pre-2022 average of 473 tonnes per year [World Gold Council, Central Banks Full Year 2025]. This demand does not respond to short-term price signals. Central banks pursue long-term reserve goals. They are price-insensitive. That is what makes their buying uniquely powerful as a price floor.
What triggered this shift? In February 2022, Western governments froze Russia’s foreign currency reserves. The message was immediate: dollar-denominated assets held offshore can be seized. The People’s Bank of China drew the direct conclusion — gold held in domestic vaults cannot be frozen by a foreign government. By April 2026, the PBOC was purchasing about eight tonnes per month. Chinese net gold imports reached 317 tonnes in the first quarter of 2026 alone — nearly three times the prior quarter’s pace [JPMorgan Global Research, May 2026]. This is not speculative portfolio rotation. It is strategic reserve diversification driven by a documented geopolitical risk calculation.
How Does the US Dollar Affect Gold’s Price?
Gold is priced in US dollars. When the dollar weakens, every non-US buyer can purchase more gold per unit of their local currency. Demand rises from multiple directions at once.
A Japanese investor, a European pension fund, and an Indian family saving for a wedding all find gold more affordable when the dollar is soft. Conversely, a strong dollar makes gold more expensive in local currency terms for international buyers, which temporarily suppresses demand.
The dollar has been losing ground for most of the current decade. US federal debt exceeds $36 trillion as of June 2026, with annual interest payments above $1 trillion. That fiscal trajectory erodes the dollar’s purchasing power over time and provides a persistent tailwind to gold.
Goldman Sachs quantifies this directly: every 50 basis points of Federal Reserve easing adds about $120 per ounce of gold price support [Goldman Sachs Global Investment Research, June 2026]. Rate cuts weaken the dollar and compress real yields at the same time. Goldman calls this the “debasement trade” — one of three pillars of their bullish thesis alongside central bank buying and de-dollarization. Investors seek assets that cannot be printed, diluted, or inflated away.
What Does “Debasement” Actually Mean — and Why Does It Matter for the Price?
Monetary debasement is when a currency loses purchasing power because more of it is created. It is why gold is expensive in a way that outlasts any single news cycle.
When a government runs persistent deficits, it finances the gap by issuing debt. If a central bank then holds rates below the inflation rate, it effectively subsidizes borrowing and dilutes the currency’s value. This is not a prediction. It is a description of what the US dollar has done since 1971, when President Nixon severed the dollar’s convertibility to gold. The dollar has lost about 87% of its purchasing power since then, according to Bureau of Labor Statistics CPI data [BLS CPI Calculator]. What $1 bought in 1971 now requires roughly $8.22.
Gold has risen in dollar terms for two compounding reasons: gold is genuinely more scarce relative to demand, and the measuring stick has gotten shorter. An ounce of gold that cost roughly $35 in 1971 costs about $4,000 today — a nominal increase of more than 11,000%. In real goods, however, one ounce still buys roughly what it always has: quality clothing, a week’s worth of staple goods, professional services. For a deeper look at how this plays out over decades, see our analysis of gold’s purchasing power over time.
The debasement trade is not a bet that gold will go up. Gold’s price tag partly measures how many dollars it takes to buy an ounce. That number keeps rising as more dollars are created.
Is Gold Fairly Priced Today, or Is It a Bubble?
As of June 2026, gold trades near $4,000 per ounce — roughly 28% below its January 28, 2026 all-time high of $5,589.38 and below every major bank’s year-end price target.
Goldman Sachs cut its 2026 year-end target to $4,900 in June 2026 [Goldman Sachs Global Investment Research, June 20, 2026]. The bank cited softening ETF inflows and the removal of near-term rate cuts from its forecast. JPMorgan holds a $6,000 per ounce target for Q4 2026. Wells Fargo forecasts $6,100 to $6,300. Bank of America sits at $6,000 [GoldSilver, Gold Price Forecast 2026]. Every one of these targets implies meaningful upside from current levels. These institutions are not arguing that gold is cheap. They are arguing it has further to run.
Fair value is model-dependent. The real yield model, the M2 money supply model, and the gold-to-Dow ratio often give different answers at the same time. For a side-by-side comparison of all three, see our analysis of whether gold is fairly priced today and what three models say.
A bubble requires speculation disconnected from fundamentals. Gold’s current price rests on three verifiable pillars: central bank buying tracked in IMF reserve disclosures, physical demand confirmed by mining data, and a monetary environment that has structurally shifted. None of that guarantees the price will rise. But it does mean the price is not arbitrary.
What This Means for Investors
Gold is expensive for the same reason anything becomes expensive. More people want it than there is supply to satisfy them. The gap has widened in a way that is structurally different from any prior cycle. Annual production growth of 1.8% is constrained by geology, not capital [World Gold Council, Gold Demand Trends Full Year 2025]. There is no lever that creates more of it quickly.
What changes is demand. The current buyers are not retail investors reacting to headlines. They are central banks pursuing long-term reserve goals. Central banks bought more than 1,000 tonnes per year from 2022 to 2024, and 863 tonnes in 2025 [World Gold Council, Central Banks Full Year 2025]. They do not sell when prices dip. That steady bid has raised gold’s structural floor in a way that will not reverse on a short-term catalyst.
For individual investors, the relevant question is not whether gold is expensive in absolute terms — it clearly is. The question is what it is expensive relative to, and whether those alternatives preserve purchasing power over time. The 5,000-year case for gold’s enduring value addresses the longer arc. The five mechanisms explained here show why the number on the price tag is what it is today.
Stay On Top of Gold & Silver Prices
Get important market alerts sent straight to your inbox.
People Also Ask
Why is gold so expensive compared to other metals?
Gold costs more than almost any other metal for two reasons: its supply is extraordinarily limited, and it serves a monetary function that industrial metals do not. Central banks hold it as a reserve asset. Investors hold it as a store of value. All the gold ever mined totals roughly 220,000 tonnes [World Gold Council, end-2025], growing at about 1.8% per year — far slower than demand. Silver, platinum, and palladium have significantly higher annual mine production and are primarily priced on industrial demand cycles. Central banks globally hold about 37,755 tonnes of gold as official reserves [World Gold Council, 2025]. No other metal functions that way.
Does gold go up when inflation rises?
Not automatically. Gold is a long-term inflation hedge, but it does not rise with every CPI print. What matters more is the real interest rate: what bonds actually pay after subtracting inflation. When inflation outpaces nominal rates, real yields fall and gold strengthens. If central banks raise rates faster than inflation rises, real yields increase and gold can underperform — as happened in 2022. PIMCO’s 2004–2025 regression shows the 10-year TIPS yield is the cleanest signal: gold strengthens when real yields fall toward zero or turn negative [PIMCO, Understanding Gold Prices].
What would make gold prices fall significantly?
Four forces would need to converge: real interest rates rising well above 2%, a strong dollar rally, a reversal of central bank buying, and significant ETF outflows. Goldman Sachs identifies this as the primary downside risk: a hawkish Federal Reserve triggering sustained Western ETF outflows [Goldman Sachs Global Investment Research, June 2026]. Each force alone is manageable. The case for lower gold requires all of them at once. That combination has not occurred during the current bull market.
How is gold’s price set?
Gold’s price emerges from a decentralized global market with two primary venues. The London OTC market trades about $180 billion per day. COMEX futures in New York trades about $114 billion per day [World Gold Council, Gold Market Primer 2025]. The London Bullion Market Association publishes twice-daily benchmark prices — the LBMA Gold Price — which serve as reference prices for contracts, ETFs, and central bank valuations worldwide. No single entity sets the price. It is the aggregate of buy and sell orders from central banks, investors, jewelry manufacturers, and individuals across every time zone.
Is gold expensive right now compared to history?
In nominal terms, gold near $4,000 per ounce in June 2026 is near its highest absolute levels — though 28% below its January 28, 2026 all-time high of $5,589.38. In inflation-adjusted terms, the 1980 peak of $850 per ounce equals roughly $3,200 today [Bureau of Labor Statistics CPI data]. The current price has already surpassed that level. Relative to US equity valuations, government debt levels, and M2 money supply growth since 1971, gold has not kept pace with the expansion of financial assets. Analysts often cite this when arguing the metal remains undervalued.
SOURCES
1. World Gold Council — Gold Demand Trends Full Year 2025; Central Banks Full Year 2025; Are We Running Out of Gold? (March 2026); Gold Market Primer: Market Size and Structure
2. PIMCO — Understanding Gold Prices
3. JPMorgan Global Research — Gold Price Predictions 2026 and Beyond
4. Goldman Sachs via TheStreet — Goldman Sachs Has Blunt Message on Gold Price for Rest of 2026
5. Goldman Sachs via Yahoo Finance — Goldman Sachs Reduced Its Gold Price Target for End of 2026
6. GoldSilver — Gold Price Forecast 2026: What the Major Banks Are Predicting Now
7. GoldSilver — Why Central Banks Are Buying Gold Again
8. Bureau of Labor Statistics — CPI Inflation Calculator
Disclaimer: This article is for informational purposes only and does not constitute financial or investment advice. Always consult a qualified financial adviser before making investment decisions.
You May Also Like:
- Gold vs. Savings Account: Which One Is Actually Beating Inflation Right Now?
- Seigniorage: The Hidden Tax on Every Dollar You Hold
- Gold Has a 0% Risk Weight and an 85% Funding Penalty. Banks Are Finally Asking Why.
- Deutsche Bank Found Gold’s Price Floor. It’s Not the Buyers You Think.
- 23 Questions to Ask Before Choosing a Gold Storage Provider
- Goldman Just Changed Its Model. Should You Change Yours?
- Gold Is Down 25%. Morgan Stanley Says One Number Unlocks $5,200.