 Silver Rises Over 120% YTD




Gold/Silver Ratio Hits 61.1 — Silver’s Turn to Run

Silver is outpacing gold for the second straight day as the gold/silver ratio compresses to 61.1. With a six-year supply deficit, stagflation signals, and central bank buying accelerating, silver’s structural case is finally finding its moment.
The 1970s Gold & Silver Bull Run: Causes, Returns, and Lessons for Investors
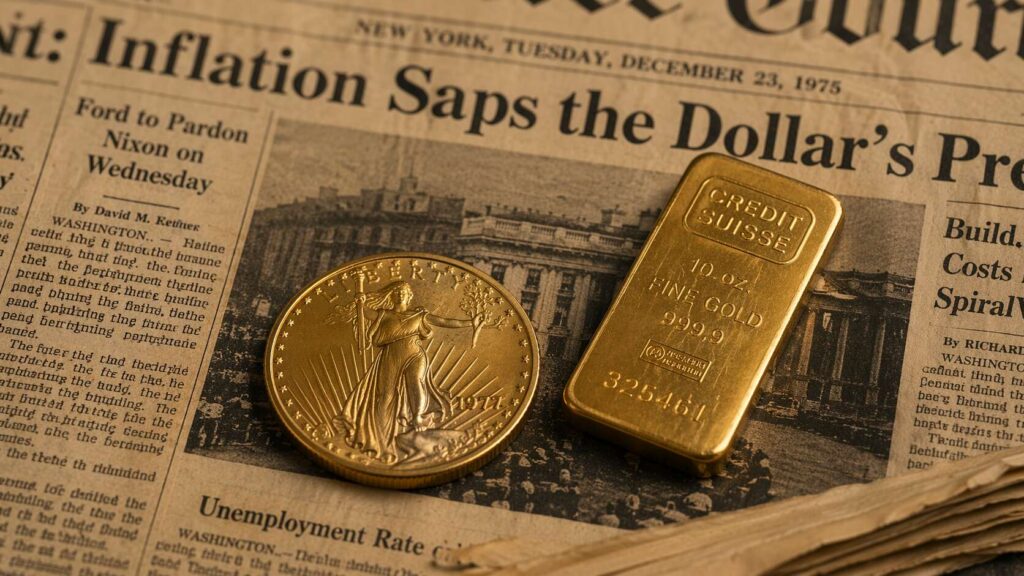
The 1970s gold and silver bull run remains one of the most dramatic wealth events of the 20th century. Gold rose 2,300%. Silver gained 400% in a single year. Understanding what drove that decade-long move — and what finally ended it — gives modern investors a precise framework for reading today’s precious metals market.
What the Silver-to-CPI Ratio Reveals That Spot Price Hides
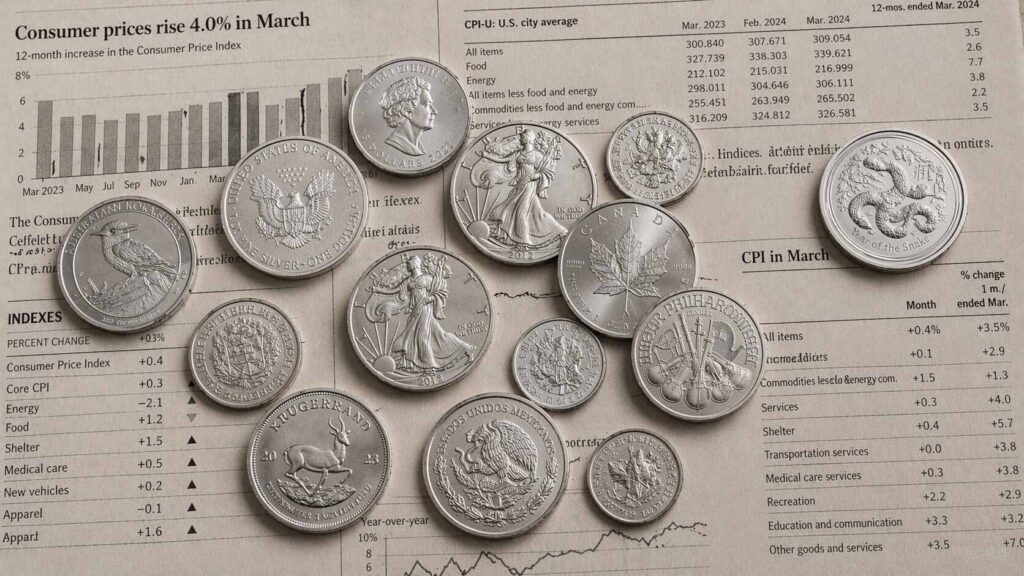
Silver hit a nominal all-time high of $121.64 in January 2026 — yet the silver-to-CPI ratio tells a different story. Adjusted for inflation, silver remains well below its 1980 peak and barely above its 2011 cycle high. Here’s what the ratio reveals that spot price alone never can.
Gold & Silver Supply and Demand: What Really Drives Prices Over Time
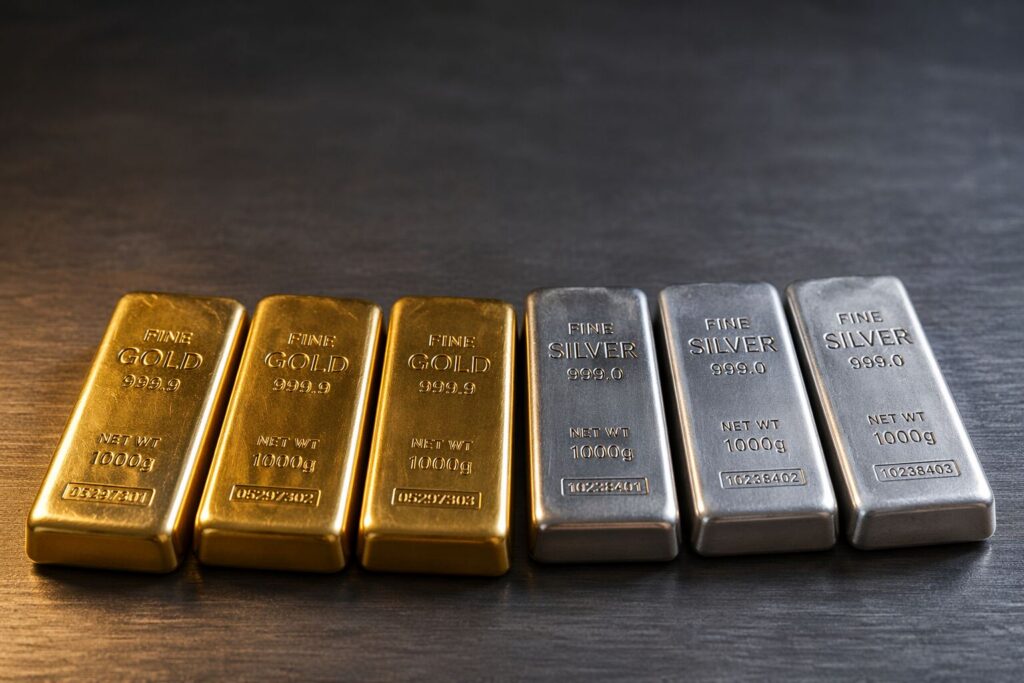
Gold and silver prices don’t move by chance. Discover the key supply and demand forces — from central bank activity and real interest rates to silver’s growing industrial role in solar and EVs — that drive precious metals prices over time and what they mean for your portfolio.
Silver Holds Near $80 as Iran Ceasefire Revives Rate-Cut Bets

Silver surged more than 5% Tuesday and is holding near $80 — the highest level since March. The move isn’t simple. When the US and Israel launched their air campaign against Iran, gold fell 10% instead of rising. The reason was oil, the Strait of Hormuz, and an inflation shock that killed rate-cut expectations. The Iran ceasefire is now reversing all three dynamics at once — and silver is responding through both its monetary and industrial demand channels. Here’s the mechanism, the data, and the one date every precious metals investor should have on their radar.


