Published: 04-15-2026, 05:52 pm | Updated: 04-16-2026, 10:05 am
Silver closed at around $79 on Wednesday — up more than 3%, outpacing gold for the second straight day. But the number that matters most isn’t silver’s price. It’s the ratio.
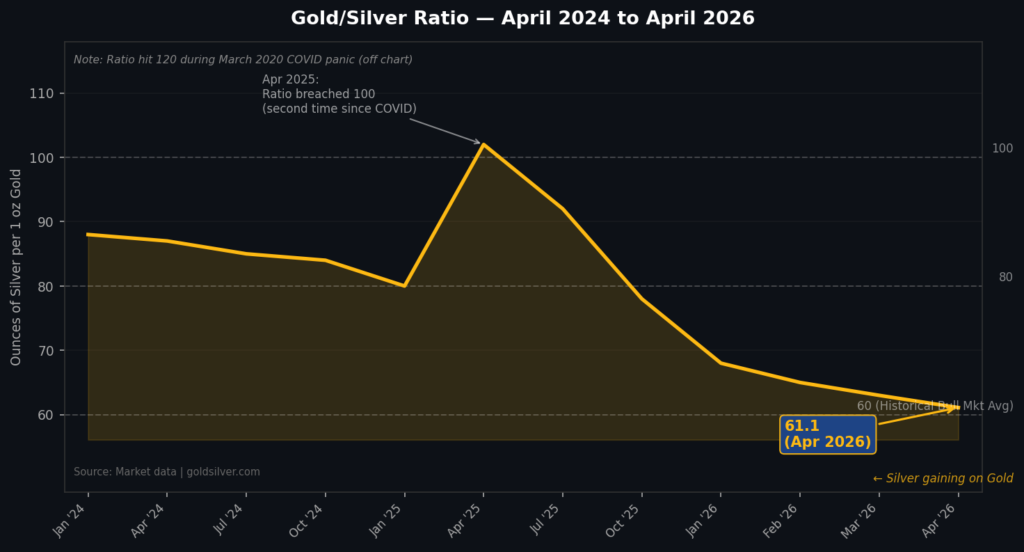
The gold/silver ratio compressed to 61.1. For anyone tracking precious metals seriously, that reading carries real information. It signals that silver is gaining ground against gold, that the bull market may be entering a new phase, and that the structural case for the white metal is finally finding its moment.
What is the gold/silver ratio — and what does 61.1 actually mean?
The ratio measures how many ounces of silver it takes to buy one ounce of gold. Today it’s 61.1.
That’s down sharply from two notable modern extremes — the 120 reading hit during the March 2020 panic, when silver cratered while gold held, and the second breach above 100 as recently as April 2025.
During sustained precious metals bull markets, the ratio has historically averaged 50–60. When it falls, it tends to signal that the bull market is entering a more structurally driven phase.
Silver lags gold early in a bull run. Then it catches up. Sometimes it overshoots.
At 61.1, the catch-up trade looks underway.
What’s driving silver right now?
The immediate catalyst is familiar: easing Middle East tensions. The US naval blockade of the Strait of Hormuz — which sent oil above $100 and hammered risk appetite — has entered a fragile ceasefire phase. Oil pulled back below $90. The dollar slid to a six-week low. When inflation fears ease and the dollar weakens together, silver catches a bid from both directions.
But the ceasefire isn’t the real story.

The Edge Every Investor Needs Smarter precious metals investing starts here. The Nuggets Newsletter brings you essential market insights, Fed updates, global trends, educational videos, and much more.
Why has silver been in supply deficit for six straight years?
The Silver Institute has documented something the market keeps underpricing: six consecutive years of supply deficit. Demand consistently outpaces mine production. The gap has been filled by drawing down above-ground inventory — a process with a finite end.
The demand side is becoming more structural, not less. AI data centers now consume significantly more silver per server rack than conventional hardware — high-performance computing requires extensive silver-coated components for thermal management and conductivity. Automotive silver demand continues to grow, driven by EVs, which use substantially more silver per vehicle than the combustion engines they replace.
This is the industrial floor under silver’s price. It holds regardless of what gold is doing, what the Fed decides, or who controls the Strait of Hormuz.
What does stagflation mean for precious metals — and are we already in it?
On April 14, the IMF released its World Economic Outlook: 2026 global growth cut to 3.1%, inflation raised to 4.4%. Slowing growth, rising prices. That’s stagflation.
It’s the macro environment where conventional savings vehicles all struggle simultaneously. Bonds lose purchasing power. Stocks face earnings pressure. Cash earns less than inflation. The 1970s — the last sustained stagflationary period — saw gold rise over 700% across the decade.
Meanwhile, the People’s Bank of China bought gold for the 17th consecutive month through March. Shanghai Gold Exchange wholesale withdrawals surged 57% month-over-month to 134 tonnes — a record pace at prices above $4,800. Seventeen consecutive months of purchases, at record prices, in record volume. China is reducing its exposure to dollar-denominated assets, and the pace is accelerating.
Central banks are telling you something. Individual investors can act on the same information.
Is gold’s rally sustainable above $4,800?
Gold closed at approximately $4,826 on April 15 — down slightly on the session but firmly above $4,800. Up around 44% from its pre-conflict levels, even after pulling back roughly 16% from its January highs of $5,594.
That resilience is the point. The war premium has been partially unwound. Gold hasn’t collapsed. The structural bid — from central banks, ETF investors, and individual savers — is holding the floor. The ratio compressing to 61.1 reflects the market finally recognizing silver as the undervalued half of the sound money pair.
How far can the ratio compress from here?
At 61.1, the ratio is approaching its historical average — but it hasn’t reached the sub-50 readings that characterized the most aggressive silver bull phases. The structural case remains intact: six years of supply deficit, accelerating industrial demand, and monetary debasement with no sign of reversal.
Once ratio compression starts in earnest, it historically goes further than markets expect. A Federal Reserve caught between inflation and slowing growth isn’t going to resolve that tension quickly.
Gold held above $4,800 this week. Silver is accelerating. The ratio has been compressing for months.
Stay On Top of Gold & Silver Prices
Get important market alerts sent straight to your inbox.
SOURCES
1. International Monetary Fund — World Economic Outlook, April 2026
2. International Monetary Fund — Press Briefing Transcript, World Economic Outlook Spring Meetings 2026
3. World Gold Council — China Gold Market Update: A Seasonal Demand Rebound in March
4. Silver Institute — Global Silver Investment to Remain Strong in 2026 Against the Backdrop of a Sixth Consecutive Annual Market Deficit
By the GoldSilver Editorial Team — helping investors understand sound money since 2005. This article is for informational purposes only and does not constitute financial, investment, or tax advice. Always consult a qualified financial advisor before making investment decisions.
You May Also Like
- Silver Holds Near $80 as Iran Ceasefire Revives Rate-Cut Bets
- The Fed Goes Silent in 3 Days – What Does That Mean For Gold?
- Gold Is Down 10% From Its War-Peak — and Still Up 46% in a Year
- Gold Outranks the Dollar at Central Banks — What It Means for Your Savings
- Hormuz Blockade Sent Gold Down 2%. Here’s Why That’s Bullish
- Gold Jumps 2% as Trump Plans Iran War Address Tonight
- $88 Billion a Month: Why U.S. Debt Is Driving Gold Prices