Published: 05-15-2026, 02:52 pm | Updated: 05-15-2026, 03:55 pm
Key Takeaways
- Silver fell around 7.7% to ~$77.11 on May 15, 2026 — completing a four-day reversal that erased the entire pre-summit rally from $77 to $86.10
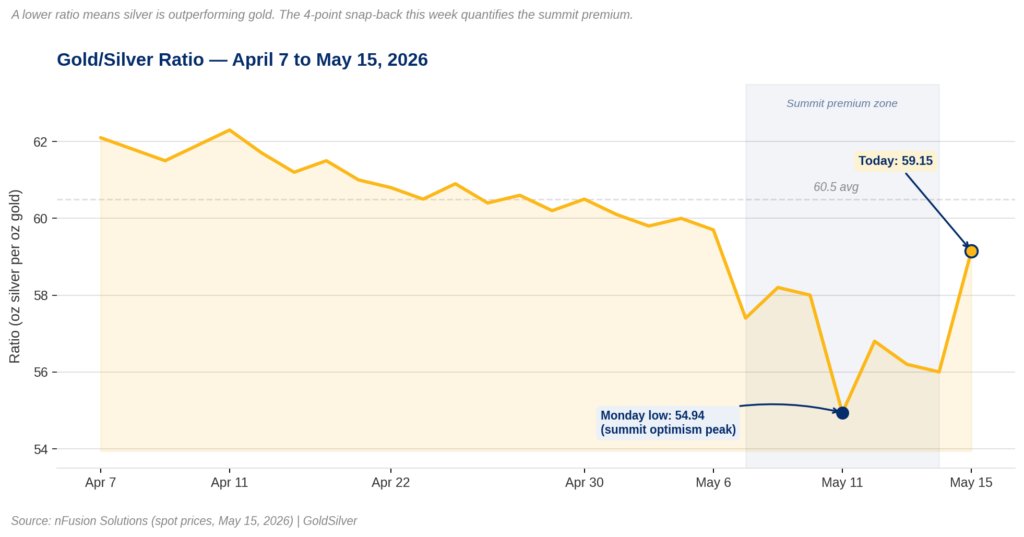
- The gold/silver ratio snapped back to ~59 from 54.94, confirming roughly $8/oz of silver’s recent price was pure trade optimism — now priced out
- The structural case is intact: six consecutive supply deficits, a 46.3 million ounce shortfall projected for 2026, and a monetary backdrop that got worse today, not better
Why is silver down today? The short answer: a summit premium built over four days just came off in one session.
Silver fell ~7.7% to $77.11 on May 15, 2026, as traders unwound that premium — the price increase markets had built into silver ahead of the Trump-Xi Beijing summit, anticipating a trade breakthrough that never came. Silver opened at $83.47 and sold off steadily through the session. It finished the day close to where it started the week, before the summit optimism began.
As a result, the structural case — six consecutive supply deficits and a deteriorating monetary environment — is unchanged. Today’s drop is the removal of short-term optimism, not a change in fundamentals.

The Edge Every Investor Needs Smarter precious metals investing starts here. The Nuggets Newsletter brings you essential market insights, Fed updates, global trends, educational videos, and much more.
Why Does Silver React So Sharply to Trade News?
Silver has two demand engines. The first is monetary: a store of value, a hedge against currency debasement, an asset held outside the banking system. The second is industrial. According to the Silver Institute’s World Silver Survey 2026, roughly 60% of annual silver demand comes from manufacturing — solar panels, EVs, semiconductors. In fact, most of those supply chains run through the US-China trade relationship.
That dual nature is why trade news moves silver harder than gold. When Trump flew to Beijing, the market priced in a real deal before one existed. A summit premium — the markup traders build in before an outcome is confirmed — pushed silver from $77 to $86.10 over four days.
The summit delivered nothing. Trump announced “fantastic trade deals” without specifying what they were. Boeing received 200 plane orders, well short of the 500 widely anticipated. Deutsche Bank’s Jim Reid noted that the hope China might help end the Iran war “did not materialize.” Then Trump said the US “doesn’t need the Strait of Hormuz open at all” — adding an inflation risk nobody had priced in before the trip.
No deal, no demand repricing. The premium came off.
What Is the Gold/Silver Ratio Saying Right Now?
The gold/silver ratio measures how many ounces of silver it takes to buy one ounce of gold. It hit 54.94 on Monday. As of May 15, 2026, it sits at 59.15. That 4-point move in four trading days is the sharpest such round-trip since early 2025. It quantifies what happened cleanly: roughly $8/oz of silver’s recent price was a bet on trade progress. The bet failed and the money left.
At $77.11, silver is sitting on its monetary floor. That’s the same base that drove silver from $60 in late 2025 to an all-time high of $121 in January 2026. Supply deficits, real yield compression, a monetary system under stress — none of that has changed.
So What Hasn’t Changed?
The supply deficit. According to the Silver Institute’s World Silver Survey 2026, silver has run a supply shortfall for six consecutive years. The 2026 projected shortfall is 46.3 million ounces. No summit outcome touches that number.
The monetary picture is also worse today than it was Monday. The 10-year Treasury yield reached 4.544% — its highest since May 2025, according to Trading Economics.
In April, the Bureau of Labor Statistics reported CPI at 3.8%, the highest since May 2023. April PPI came in at 6% annually, the highest in nearly four years. CME FedWatch now prices roughly a 51% probability of a Fed rate hike by December.
The summit that failed on trade also extended the Hormuz standoff. That’s the same event behind today’s inflation data. Silver’s industrial demand thesis took a hit today. Its monetary thesis got a new data point in its favor.
SOURCES
1. nFusion Solutions — Silver & Gold Spot Prices — May 15, 2026
2. Silver Institute — World Silver Survey 2026 — Metals Focus, April 15, 2026
3. Fortune / UBS — Wall Street Sees ‘Nothing of Real Substance’ in Trump’s China Trade Deal — May 15, 2026
4. Fortune / Deutsche Bank — Wall Street Sees ‘Nothing of Real Substance’ in Trump’s China Trade Deal — May 15, 2026
5. US Bureau of Labor Statistics — Consumer Price Index — April 2026
6. US Bureau of Labor Statistics — Producer Price Indexes — April 2026
7. FRED, St. Louis Fed — 10-Year Treasury Constant Maturity Rate (DGS10)
8. CME Group — CME FedWatch Tool — Fed Rate Probabilities, May 15, 2026
9. CNBC — Trump-Xi Summit: The 3 Big Takeaways — May 15, 2026
Disclaimer: This article is for informational purposes only and does not constitute financial or investment advice. Always consult a qualified financial adviser before making investment decisions.
You May Also Like:
- Gold Fell. China Bought Its Most in 17 Months. Here’s Why.
- Why Silver Falls Harder Than Gold — And What It Means
- Gold Near $4,700: The Chaos Isn’t a Ceiling. It’s a Floor
- 5 Forces Shaping Gold and Silver at the Beijing Summit
- The Real Reason Gold Falls When Inflation Surges
- CPI Hits 3.8%. Gold Falls. The Mechanism Nobody Explains
- Why the Gold Silver Ratio Is Falling — and What It Means
- What’s Moving Gold Prices This Week: CPI, Seoul & Beijing