Published: 05-21-2026, 04:24 pm
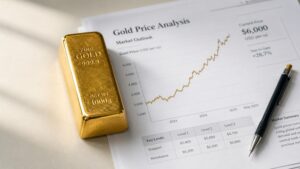
Silver fell 12% in one week. Gold fell 3%. Understanding why silver falls more than gold comes down to one structural difference: roughly 60% of silver demand is industrial. When trade optimism fades, that premium unwinds fast. As a result, the gold-to-silver ratio expanded from 55 to 59 in ten days. Gold trades at $4,544 and silver at $76.84 (spot, May 21, 2026). Here’s what the divergence is telling you.
Both metals sold off this week. The headwinds were identical: rising Treasury yields, stalled Iran peace talks, and FOMC minutes (April 28–29) signaling rate hikes. Both metals faced the same macro pressure. But silver gave back four times as much ground as gold. That’s not a coincidence. It’s a mechanism.
Consequently, the gold-to-silver ratio sits at 59.1-to-1, up from 54.9 on May 11. Silver dropped $10.68 from its May 14 intraday high. Gold, meanwhile, dropped $144, or 3.1%.
Why Does Silver Fall Harder Than Gold
Roughly 60% of annual silver demand is industrial — solar panels, EVs, semiconductors, AI data centers. When the Trump-Xi summit raised hopes for US-China trade stabilization, industrial demand repriced upward instantly. As a result, silver surged over 7% in the days before the Beijing meetings. The gold-to-silver ratio compressed from 62 to below 55 in days.
However, when the summit disappointed — no deal, no agreement, no momentum — that premium unwound just as fast. That’s silver’s nature. The sensitivity cuts both ways.
Gold, by contrast, trades on monetary demand: central bank reserves, inflation hedging, and safe-haven flows. None of that evaporated when the summit failed. Central banks are still diversifying away from the dollar. The US carries $39 trillion in national debt. Moreover, on May 16, Moody’s cut the US sovereign rating from Aaa to Aa1. That removed the last top-tier rating from any major agency. Gold’s buyers don’t need a trade deal. They need a reason to trust paper money — and that reason keeps getting harder to find.
Stay Ahead with Gold & Silver News The most important market insights, Fed updates, and global trends — everything investors need to make smarter, safer decisions.
What Is the Gold-to-Silver Ratio Signaling Right Now?
At 59.1, the ratio is mid-range. It was 62 before the summit, compressed to 55 during, and has since snapped back to 59. The 20-year average is around 70; the post-2000 average runs 60–65.
Silver isn’t historically cheap here, but it isn’t expensive either. The round-trip — 62 to 55 to 59 in three weeks — shows exactly how silver trades in 2026. It’s a hybrid: when industrial optimism rises, silver leads; when optimism fades, silver gives it back first.
In practice, a ratio above 60 has historically been a reasonable moment to tilt toward silver. Below 55, gold tends to be the better call. At 59, the ratio is neutral — but it arrived here by falling from a much more silver-favorable level. As a result, the window is narrowing, not widening.
Did the Silver Supply Deficit Change This Week?
No. The Silver Institute’s World Silver Survey 2026 projects a 46.3-million-ounce supply deficit this year — the sixth consecutive annual shortfall. Since 2021, global stockpiles have lost roughly 762 million ounces of above-ground silver. In addition, China’s export restrictions took effect January 1, 2026. They tightened supply further by limiting who can ship refined silver out of the country.
None of that changed this week. What changed, instead, was sentiment — the market’s short-term read on industrial demand after the summit failed. The 10-year Treasury yield remains elevated at 4.62%. Furthermore, FOMC minutes showed an 8-4 vote, the most divided Fed in decades. The rate environment isn’t resolving soon in either direction.
What Should Precious Metals Investors Watch Next?
US flash PMI and jobless claims (due May 22) will test whether industrial demand has real legs. A strong reading rebuilds silver’s premium. A weak result, however, extends the consolidation.
The structural case hasn’t changed: a six-year supply deficit, surging industrial consumption, and a monetary role no trade deal can touch. One week’s price action doesn’t alter the fundamentals. It simply moved the price — and a lower price on unchanged fundamentals isn’t a warning. It’s information.
Stay On Top of Gold & Silver Prices
Get important market alerts sent straight to your inbox.
People Also Ask
Why does silver fall more than gold in a selloff?
Silver falls harder because roughly 60% of its annual demand is industrial — solar panels, EVs, and semiconductors. Gold, by contrast, trades almost entirely on monetary demand. Therefore, when economic optimism fades, silver’s industrial premium reprices down fast. Gold holds its floor because central bank buying, inflation hedging, and safe-haven demand are structural forces. They don’t disappear when a trade summit disappoints.
What is the gold-to-silver ratio?
The gold-to-silver ratio measures how many ounces of silver it takes to buy one ounce of gold. As of May 21, 2026, it stands at 59.1-to-1. In other words, gold at $4,544 buys 59.1 ounces of silver at $76.84. The 20-year average is approximately 70, meaning silver is still relatively expensive by historical standards. Investors use the ratio as a signal for when to tilt allocations between the two metals.
Is there a silver shortage in 2026?
Yes. The Silver Institute projects a 46.3-million-ounce deficit for 2026 — the sixth consecutive annual shortfall. Specifically, flat mine supply and surging industrial demand from solar, EVs, and AI infrastructure are driving the gap. China’s January 2026 export restrictions have tightened the market further still.
Is now a good time to buy silver?
At 59.1, the gold-to-silver ratio sits below its 20-year average of 70. That means silver isn’t cheap on a historical basis. However, the supply deficit and industrial demand story remain fully intact. Consequently, a lower price on solid fundamentals is worth understanding before making any allocation decision.
SOURCES
1. Silver Institute — World Silver Survey 2026
2. Moody’s — US Sovereign Credit Rating: Aaa Downgraded to Aa1
3. Federal Reserve — FOMC Minutes, April 28–29, 2026
4. Federal Reserve — FOMC Statement, April 29, 2026
5. US Treasury Fiscal Data — Federal Debt
6. China silver export restrictions, effective January 1, 2026 — source pending editorial review
Disclaimer: This article is for informational purposes only and does not constitute financial or investment advice. Always consult a qualified financial adviser before making investment decisions.
You May Also Like:
- Gold Price Holds Firm After Hawkish Fed Minutes — Here’s Why
- Why London Still Sets the Gold Price — and Asia Doesn’t
- Gold Price at ~$4,502: Is the Dip a Buy? BofA Says $6,000
- Gold Didn’t Fall on Iran Peace News. That’s the Point.
- Trump Called Off the Strike. Gold’s Real Risk Is Still $39 Trillion.
- The Gold Market Is Mostly Paper. Dubai Disagrees.
- The Institutions Are Buying. Yields Are Rising. What Does That Tell You?
- Gold Up 40% in a Year. The Moody’s Downgrade Explains Why.