Published: 06-09-2026, 12:42 pm
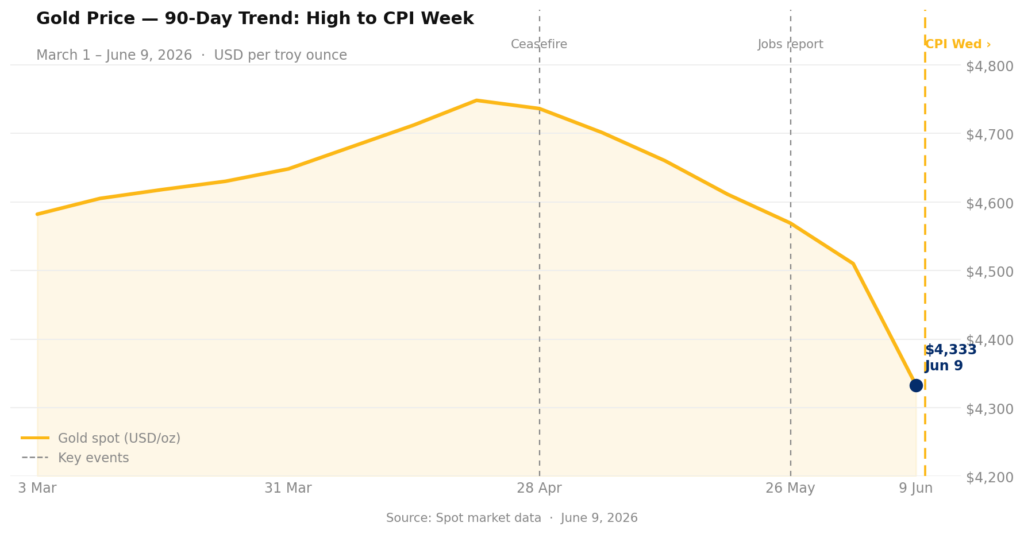
Gold is sitting at $4,329 this Tuesday afternoon. It’s down roughly 9% from its high seven weeks ago. One inflation number — releasing at 8:30 AM ET Wednesday — could push it meaningfully in either direction.
Key Takeaways
- Why is gold falling in June 2026? Gold has retreated roughly 9% from its late April high near $4,800. Two forces drove the move: the partial Iran–Israel ceasefire unwound the geopolitical risk premium, and the blowout May jobs report (172,000 vs. 85,000 consensus) repriced Fed rate-hike odds to approximately 68–70% by December — up from roughly 14% five weeks ago.
- What does the May CPI report mean for gold? The May CPI drops June 10 at 8:30 AM ET. Consensus: headline +4.2% year-over-year, core +0.3% month-over-month. A hot core print above +0.3% pushes gold toward $4,280–$4,300 support short-term. An inline or softer print stabilizes or reverses toward $4,400–$4,450.
- Is the pullback a structural reversal? No. The mechanism is rising real yield expectations — not a change in the monetary debasement thesis that drove gold from roughly $1,200 in 2018 to nearly $5,600 in January 2026. This is mid-cycle consolidation.
- What is the fiscal constraint argument? At approximately $39 trillion in federal debt, the Fed cannot tighten aggressively without increasing debt service costs — making conventional inflation-fighting structurally constrained. That remains favorable for gold across both CPI scenarios on a 3–5 year horizon.
That number isn’t gold’s price. It’s May CPI.
What’s Happening to Gold Right Now?
Gold has been consolidating since late April. Spot prices briefly touched the mid-to-upper $4,700s on April 20. As of June 9, 2026, the metal is trading near $4,329. That is its lowest level since late March. Two converging forces hit the market in the space of eight days.
First, Iran and Israel announced a conditional halt to hostilities. The geopolitical bid that had supported gold through much of April unwound fast. When the risk premium exits a trade, it tends to exit all at once.
Second, and more importantly for the upcoming CPI print: the May jobs report came in strong. Non-farm payrolls surprised sharply to the upside — 172,000, more than double the 85,000 consensus. The unemployment rate held steady at 4.3%. The bond market repriced immediately.
On the CME FedWatch tool, the probability of at least one quarter-point rate hike before December 2026 surged to approximately 68–70%. Five weeks ago, that probability sat near 14%. Before last Friday’s report, it was around 52%. The jump is significant.
That shift in rate expectations is the mechanism behind gold’s pullback. It is not a change in the structural case for holding physical metal. It is a change in the short-term cost of holding it.
Understanding the difference matters more than knowing the current price.

The Edge Every Investor Needs Smarter precious metals investing starts here. The Nuggets Newsletter brings you essential market insights, Fed updates, global trends, educational videos, and much more.
Why Does a Rate Hike Threat Push Gold Down?
Gold doesn’t pay interest. When bond yields rise — or when the market believes they will — the opportunity cost of holding gold goes up. A 4.5% Treasury yield is real competition for a non-yielding asset. As that yield climbs, institutional allocators who hold gold on the margin start to trim.
This dynamic is well-documented in the data. The 10-year real yield is the single best short-term predictor of gold price moves. That’s the nominal Treasury yield minus inflation expectations. When real yields rise, gold typically retreats. When real yields compress, gold advances.
Right now, nominal yields are rising faster than inflation expectations. That pushes real yields higher. Hence gold’s retreat.
But here’s what that analysis leaves out.
What the Rate-Hike Story Is Missing
The headline narrative — “Fed might hike, gold is under pressure” — is correct as far as it goes. What it doesn’t account for is the structural backdrop.
The NFIB Small Business Optimism survey, released this morning, showed the index slipping to 95.3. That is below its 52-year historical average of 98. Meanwhile, the uncertainty index jumped to 91. Its long-term average is 68. These are not the readings of an economy solving its inflation problem.
They are the readings of an economy where price pressure has moved beyond energy. Higher costs are getting passed to consumers regardless of what happens with oil.
The May CPI consensus reflects this. Headline inflation is forecast at +4.2% year-over-year. Energy from the Iran conflict accounts for a large portion of that jump. But core CPI — excluding food and energy — is forecast at +2.9% year-over-year. That is not oil. That is tariff passthrough and wage pressure.
This is why the rate-hike threat is more complicated for gold than a simple yield model suggests. The Fed faces a real fiscal constraint. At approximately $39 trillion in federal debt, every quarter-point hike meaningfully increases annual debt service costs.
A Fed that cannot tighten aggressively cannot solve inflation by conventional means. It navigates between two versions of the same problem. Gold tends to do well in both — just on different timescales.
What Does a Hot CPI Print Actually Mean for Your Gold?
Here is the scenario split that matters for physical holders.
Scenario A — CPI Prints Hot
Above +4.2% headline: Bond yields spike. Rate-hike probability surges past 70%. Gold tests $4,280–$4,300 support short-term. This is the scenario the market is positioned for. It is also where central bank buyers — who have been accumulating gold for 18 consecutive months — may see a cleaner entry. Institutional demand doesn’t disappear because yields tick up 15 basis points.
Scenario B — CPI Prints Inline or Softer
At or below consensus: The rate-hike narrative loses momentum. Real yields stabilize or compress. Gold stabilizes at current levels or rebounds toward $4,400–$4,450. Not the market consensus. But it is the outcome that most comfortably fits the longer-term thesis.
Either way, the structural argument hasn’t changed. Gold ran from roughly $1,200 in 2018 to nearly $5,600 in January 2026. That move was driven by central bank de-dollarization, persistent inflation, and an expanding global money supply. A 9% pullback, driven by a short-term repricing of Fed rate expectations, is not a structural reversal. It is mid-cycle consolidation.
The last time real yields moved this sharply — in Q3 2023 — gold pulled back roughly 6–8% before resuming its structural advance. The pattern here rhymes.
What Does the CPI Core Number Actually Tell You?
The CPI release lands at 8:30 AM ET on Wednesday, June 10. The number to watch isn’t the headline. Energy prices have been in the data for weeks. The market already knows it.
Watch core CPI month-over-month. Consensus is +0.3%. A print of +0.4% or higher gives the rate-hike narrative a fresh leg. Gold will feel it in the morning session.
Beyond the print: the FOMC meets June 16–17. Markets are pricing a near-certain hold at that meeting. The real question is December. The answer depends on whether the next three CPI prints show core inflation re-accelerating or stabilizing. This is the first data point in that sequence.
The honest framework for long-term physical holders: nothing in this CPI print changes the 3–5 year case for why you own gold. What it may change is the entry price for adding to a position. That’s not a crisis. That’s an opportunity to understand the mechanism — and act with clarity instead of noise.
Stay On Top of Gold & Silver Prices
Get important market alerts sent straight to your inbox.
SOURCES
1. LBMA — Precious Metal Prices & Historical Data
2. Bureau of Labor Statistics — The Employment Situation, May 2026 (USDL-26-0786)
3. CME Group — FedWatch Tool, 30-Day Federal Fund Futures
4. Kiplinger — What to Expect From the May CPI Report
5. Morningstar — May CPI Forecasts Show Continued Lofty Inflation
6. NFIB — Small Business Optimism Index, May 2026
7. Joint Economic Committee — Monthly Debt Update, June 2026
8. World Gold Council — Central Bank Gold Statistics, April 2026
9. CNBC — Jobs Report May 2026: Payrolls +172,000
10. Trading Economics — Gold Spot Price, Historical Data
11. Reuters — Gold Hits All-Time High, January 29, 2026
Disclaimer: This article is for informational purposes only and does not constitute financial or investment advice. Always consult a qualified financial adviser before making investment decisions.
You May Also Like:
- Gold Price News: Goldman, China, CPI, and the Fed Explained
- Gold Near $4,330 as Rate-Hike Bets Hit 70% and China Acts
- Gold Is Down 22% — The Same Drop as 2022. The Floor Is Not the Same.
- Silver Falls 6% on Jobs Beat. The Six-Year Deficit Didn’t.
- Gold Rate Hike Fears Are Weighing on Prices. Here’s the Full Picture.
- Gold at $4,480: Physical Demand Hits a 50-Year Milestone
- Gold Holds $4,481 With Rate Hike Risk Rising. Here’s the NFP Decision Map.
- Gold Surges 1.5%: ADP, ISM, and Beige Book Trap the Fed
- Gold at $4,454 Says the Fed Is Trapped. Here’s Why.
- Central Banks Picked Gold Over Treasuries. Should You?
- Central Banks Just Crossed a Line Not Seen Since 1996