Silver Rises Over 120% YTD




Published: 07-14-2026, 03:59 pm
Key Takeaways
- Silver trades at $58.55 as of July 14, 2026 — down 52% from its January all-time high of $121.62.
- The gold-silver ratio stands at 69.2:1, near the top of its 50-year historical range, signaling silver is undervalued relative to gold.
- June CPI came in at 3.5% year-over-year — sharply lower than May’s 4.2% and the first monthly decline since April 2020. That data point is silver-positive.
- The FOMC meets July 28–29. A hold decision eases real-yield pressure on silver. A hike extends it.
- The structural case — sixth consecutive supply deficit, 46.3 million ounce shortfall, 58% industrial demand share — has not changed.
- The LBMA’s 2026 analyst consensus is $79.57 per ounce. JPMorgan’s base case is $81. Both remain well above current prices.
The silver price outlook for July 2026 starts at $58.55 — roughly 52% below the all-time high of $121.62 set in January. The question is not where silver has been. Instead, it is what two specific macro events this month mean for where it goes next.
Silver Spot Price — Last 30 Days
USD per troy ounce | Jun 15 – Jul 14, 2026
Source: goldsilver.com/price-charts | Highlighted dates: Jun 17 FOMC decision, Jul 8 FOMC minutes, Jul 14 June CPI release.
Why Is Silver Down So Much From Its January High?
Three factors drove the correction from $121.62 to current levels. Specifically, each is traceable and reversible. First, the Fed under Chair Kevin Warsh held rates at 3.50–3.75% at its June meeting and revealed a deeply divided committee. Of the eighteen officials who submitted dot-plot projections, nine favored at least one rate hike before year-end, eight projected no change, and one projected a cut. [Federal Reserve]
That shift pushed real Treasury yields higher. Specifically, higher real yields raise the opportunity cost of holding non-yielding assets like silver. Second, May CPI ran at a hot 4.2% year-over-year, driven by energy costs following Strait of Hormuz disruptions. [Bureau of Labor Statistics] As a result, the inflation data reinforced the Fed’s hawkish posture. Third, silver’s 58% industrial demand component made it more vulnerable than gold. [Silver Institute]
A hawkish Fed that slows growth hits silver’s industrial engine directly. Furthermore, gold has no comparable vulnerability. Consequently, the gold-silver ratio expanded from its May low near 55:1 to approximately 69:1 today.
None of these factors changed the supply-demand structure. In short, the correction changed the price. It did not change the thesis.
The Knowledge That Changes Everything

Two essential guides — yours free. Understand why gold matters and why fiat currencies always fail.
What Does June CPI Mean for the Silver Price Right Now?
The June CPI report, released July 14, 2026, landed softer than expected. Headline CPI fell 0.4% month-over-month — the largest monthly decline since April 2020 — and slowed to 3.5% year-over-year from 4.2% in May. [Bureau of Labor Statistics] Core CPI eased to 2.6% from 2.9%.
The mechanism is direct. Specifically: Lower inflation reduces urgency for additional Fed rate hikes. When rate-hike expectations fall, real yields ease. When real yields ease, the opportunity cost of holding non-yielding physical silver falls. As a result, markets responded the same day: silver rallied on the print, touching $59.12 intraday before settling at $58.55. [GoldSilver] That is the mechanism working in real time.
The June print does not resolve everything on its own, however. Nevertheless, it is the most important near-term data point before the July 28–29 FOMC meeting, and it points in the silver-positive direction.
What Does the July 28–29 FOMC Meeting Mean for Silver?
The next Fed rate decision is July 29, 2026 — and it matters directly for silver. Importantly, this meeting does not produce a dot plot or Summary of Economic Projections. [Federal Reserve] As a result, markets will be watching Chair Warsh’s press conference language for signals about September — the next meeting with a formal rate forecast.
Going into the meeting, the June CPI print has already shifted odds toward a hold. A hold decision would, therefore, reduce real-yield pressure on silver. A surprise hike, conversely, would extend it. The structural ceiling matters here too: total US gross national debt stood at $39.39 trillion as of July 6, 2026, with annual interest expense already exceeding $1 trillion. [U.S. Treasury Fiscal Data] Accordingly, that fiscal constraint limits how aggressively the Fed can tighten before the Treasury’s own borrowing burden becomes the dominant concern. For the full macro context, see GoldSilver’s July 2026 gold price outlook.
Is the Silver Supply Deficit Still Relevant in July 2026?
Yes — and importantly, the price correction has not changed it. The Silver Institute’s World Silver Survey 2026, published April 15, 2026 with research by Metals Focus, confirmed the sixth consecutive annual supply deficit at 46.3 million ounces — wider than 2025’s 40.3 million ounce gap. [Silver Institute] In fact, since 2021, the cumulative drawdown from above-ground stocks has reached 762 million ounces.
Mine production is projected at 844.1 million ounces — essentially flat. That is because approximately 74% of silver is produced as a byproduct of copper, lead, and zinc mining. Those operations respond to base-metal economics, not silver economics. Consequently, higher silver prices have not produced more silver. The supply response simply has not materialized. For the full analysis, see GoldSilver’s deep-dive on the 2026 silver supply deficit.
Industrial demand — 58% of total consumption — adds a structural floor that gold does not have. [Silver Institute] Solar photovoltaics, EVs, semiconductors, and AI data-center infrastructure are all consuming silver at volumes that mine supply cannot match. Moreover, each of those sectors is growing. Furthermore, that demand does not respond to short-term price corrections.
What Does the Gold-Silver Ratio Signal in July 2026?
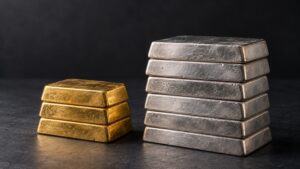
The gold-silver ratio stands at 69.2:1. In other words, it currently takes 69 ounces of silver to buy one ounce of gold. Notably, that is near the top of the 50-year historical range. The modern 50-year historical average falls between 60:1 and 70:1. At 69:1, therefore, silver is near the top of its historical valuation range relative to gold — a level that has historically preceded periods of silver outperformance. Notably, the ratio reached approximately 55:1 as recently as May 2026, before the hawkish Fed repricing widened it again. [GoldSilver]
Using today’s gold price of $4,049, therefore: a compression to 65:1 implies silver at $62.30. A compression to 55:1 — a level reached during prior bull cycles — implies silver at $73.60. The ratio is a valuation tool, not a forecast. Nevertheless, at 69:1 it clearly says silver is historically cheap relative to gold. GoldSilver’s guide to reading the gold-silver ratio covers the full historical context.
Where Do Analysts See the Silver Price Heading?
The LBMA’s 2026 Annual Precious Metals Forecast Survey drew on 26 analysts. Their full-year consensus: $79.57 per ounce. [LBMA] Specifically, JPMorgan’s base case is $81 per ounce. [J.P. Morgan Global Research] HSBC forecasts approximately $75. Goldman Sachs identified $85 to $100 as achievable if industrial demand holds. All of these forecasts, moreover, were set before the correction. Notably, therefore, not one major institution has revised its full-year average below current spot prices. In other words, the consensus view has not shifted to match the price decline.
Stay On Top of Gold & Silver Prices
Get important market alerts sent straight to your inbox.
People Also Ask
What is the silver price today in July 2026?
As of July 14, 2026 at 2:49 PM ET, silver trades at $58.55 per ounce, according to GoldSilver’s live price charts. The intraday high was $59.68 and the intraday low was $56.87. Silver is up 1.56% on the day following the softer June CPI report.
What is the gold-silver ratio right now?
The gold-silver ratio on July 14, 2026 is approximately 69.2:1. Moreover, the modern 50-year average sits between 60:1 and 70:1. In other words, at 69:1, silver is near the historically elevated end of its valuation range relative to gold — a level that has repeatedly preceded silver outperformance.
Is the silver supply deficit still happening in 2026?
Yes — and importantly, the deficit is widening. The World Silver Survey 2026 projects a 46.3 million ounce shortfall — the sixth consecutive annual deficit, and wider than 2025’s 40.3 million ounce gap. Since 2021, the cumulative drawdown from above-ground stocks has reached 762 million ounces. [Silver Institute]
What do analysts forecast for the silver price in 2026?
The LBMA’s 2026 Forecast Survey consensus is $79.57 per ounce. [LBMA] JPMorgan’s base case is $81. [J.P. Morgan Global Research] HSBC forecasts $75. Goldman Sachs put $85 to $100 as achievable. All remain well above current prices near $58–59.
How does the July 28–29 FOMC meeting affect silver?
The Fed’s July 29 decision does not include a dot plot or SEP. [Federal Reserve] As a result, markets are watching Warsh’s language for September signals. A hold or dovish language would therefore ease real-yield pressure on silver. A surprise hike would extend it. The June CPI print at 3.5% has already shifted the odds toward a hold. [Bureau of Labor Statistics]
SOURCES
1. Federal Reserve — FOMC Summary of Economic Projections, June 17, 2026
2. Bureau of Labor Statistics — Consumer Price Index Summary, June 2026 (July 14, 2026)
3. Bureau of Labor Statistics — Consumer Price Index Summary, May 2026 (June 10, 2026)
4. Silver Institute / Metals Focus — World Silver Survey 2026 (April 15, 2026)
5. J.P. Morgan Global Research — Silver Prices 2026 Outlook
6. GoldSilver — Live Gold and Silver Spot Prices, July 14, 2026
7. LBMA — 2026 Annual Precious Metals Forecast Survey
8. CME Group — FedWatch Tool, September 2026 Rate Hike Probabilities
9. U.S. Treasury Fiscal Data — Debt to the Penny, July 6, 2026
Disclaimer: This article is for informational purposes only and does not constitute financial or investment advice. Always consult a qualified financial adviser before making investment decisions.
You May Also Like:
- Why the 10-5-3 Rule Fails Gold and Silver Investors
- Why Is Silver So Hard to Mine? The Primary Supply Problem Explained
- Gold Price Outlook July 2026: The Price Fell. Case Intact.
- Buying the Top: A Survival Guide for Gold and Silver Investors
- How Do Gold Price Cycles Work? A Framework Across Four Time Horizons
- The $300 Billion Lesson: What Frozen Reserves Taught Central Banks About Gold
- How To Perform Silver Technical Analysis (in 5 Steps)