Published: 06-15-2026, 10:32 am | Updated: 06-15-2026, 10:36 am
In today’s update: Gold silver prices today are up sharply: gold around+3.4% to $4,362, silver around +4.7% to $71.20. The confirmed US-Iran peace deal has sent oil to a two-month low, central banks bought 244 tonnes of gold in Q1 and never stopped, and Warsh’s first Fed dot plot arrives tomorrow.
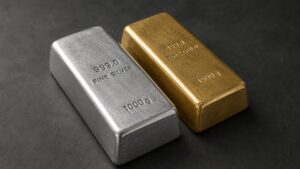
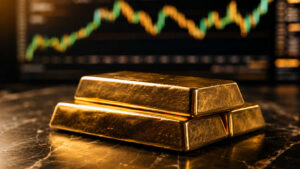
Gold is up 3.4% to $4,362 and silver is up 4.7% to $71.20 on June 15, 2026, as a confirmed US-Iran peace deal collapsed oil prices and eased the inflation pressure that has suppressed precious metals since February. The move is larger than a single headline. Four other forces are running beneath it: central bank buying, ETF positioning, silver’s industrial engine, and tomorrow’s Federal Reserve dot plot. Together they explain what is driving gold and silver prices today. (goldsilver.com/price-charts/, 9:33 AM ET)
Is the $80 Oil Price What Actually Matters Today?
WTI crude fell to around $80 a barrel on Monday, its lowest level since late March. The peace deal triggered the drop, but the specific number matters more than the direction. Energy drove more than 60% of May’s 4.2% CPI reading, according to the Bureau of Labor Statistics. With oil below $80, the inflation component that forced markets to price in a December rate hike begins to deflate. Gold is sensitive to real yields, the return on government bonds after inflation, and when oil falls, real yield pressure eases with it. The CME FedWatch Tool showed December rate hike odds falling from 69% to approximately 64% this morning following the peace announcement, a 5-point swing since the deal was confirmed. That compression is the mechanism behind today’s rally. Lower oil does not just remove a geopolitical headline. It directly changes what the Federal Reserve’s dot plot can say tomorrow.
The Edge Every Investor Needs Smarter precious metals investing starts here. The Nuggets Newsletter brings you essential market insights, Fed updates, global trends, educational videos, and much more.
Why Is Silver Outperforming Gold Today?
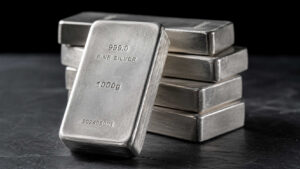
Silver’s 4.7% gain is running nearly 1.4 times gold’s move, and the gap is not random. Silver has two demand engines, and both are firing at once. The monetary engine works like gold’s: lower oil eases inflation, real yields compress, and non-yielding metals benefit. The industrial engine is silver’s alone. Four months of Strait of Hormuz disruption raised manufacturing input costs and suppressed demand for a metal used in solar panels, electronics, and electric vehicles. A reopened strait means lower energy costs for factories, and the industrial bid returns. The Silver Institute projects a sixth consecutive annual supply deficit of 46.3 million ounces in 2026, according to the World Silver Survey 2026. That structural shortfall never went away during the war. It just waited. The gold-silver ratio has moved from 65.2 on June 9, its highest point of the month per goldsilver.com/price-charts/, to approximately 61.3 this morning.
What Did Central Banks Do With Gold During the War?
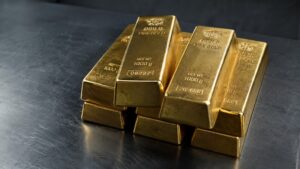
They kept buying. The World Gold Council reported net central bank purchases of 244 tonnes in Q1 2026, above the five-year average, even as gold fell from its January highs. In April, the National Bank of Poland added 14 tonnes, the People’s Bank of China added 8 tonnes, its highest monthly purchase since December 2024, and the Czech National Bank recorded its 38th consecutive monthly purchase. China has now added to reserves for 18 straight months. Goldman Sachs revised its central bank demand model in May, raising its estimate to approximately 60 tonnes per month through 2026, after London vault data revealed previously unrecorded sovereign buying. These institutions did not sell because the war suppressed prices. The correction was not a warning to them. It was a buying window.
Are ETF Investors Already Positioned for This Rally?
No. And that is what makes the setup interesting. Global physically backed gold ETFs recorded net outflows of $2 billion in May, according to the World Gold Council’s Gold ETF Flows report published June 4, 2026. North America and Asia led the selling. Total holdings sit at 4,121 tonnes, just below the record of 4,176 tonnes reached on February 27, 2026, per the same report. Year-to-date flows remain positive at nearly $17 billion, but May’s retreat reflected Western investors stepping back as oil-driven inflation kept rate-hike expectations elevated. Morgan Stanley has estimated that gold ETFs represent only 0.17% of US private financial portfolios, well below the 2012 peak. Every one basis point increase in that allocation share adds approximately 1.4% to the gold price. The investors who trimmed in May have not yet returned. Today’s peace deal and tomorrow’s FOMC give them a reason to reconsider.
What Does the FOMC Tomorrow Mean for Gold This Week?
The rate decision is settled. CME FedWatch priced a 97% probability of a hold at 3.50%–3.75% at the June 16–17 meeting. Kevin Warsh, sworn in as the 17th Federal Reserve Chair on May 22, 2026, chairs his first meeting tomorrow. What markets will read closely is the dot plot, the committee’s projected rate path through 2026 and 2027. When the last dot plot published in March 2026, the dominant scenario showed one hike by year-end. With oil at $80 and a peace deal confirmed, that scenario has materially weakened.
Analysts at Vital Knowledge noted Monday that lower oil prices give Warsh room to signal a dovish lean. In their words, he “could put his thumb on the scale during the press conference and tip things in a dovish direction.” A neutral-to-dovish dot plot removes the real yield ceiling suppressing gold since February. A hawkish one tests today’s rally. The answer arrives Wednesday at 2 PM ET.
Five stories. One thread. Oil falling changes the inflation math. Changed inflation math changes what the Federal Reserve can signal tomorrow. And the buyers who would drive the next leg, Western ETF investors, are not yet in the market, while central banks never left it. For long-term holders of physical gold and silver, today is not a signal to act. It is a reminder that the mechanism suppressing prices since February was specific and temporary, not structural. The structural case has not changed. Today it just got a little easier to see.
Stay On Top of Gold & Silver Prices
Get important market alerts sent straight to your inbox.
SOURCES
1. GoldSilver.com — Live Gold & Silver Price Charts
2. CME Group (NYMEX) — WTI Crude Oil Futures
3. CME Group — FedWatch Tool
4. Bureau of Labor Statistics — Consumer Price Index, May 2026
5. World Gold Council — Central Bank Gold Statistics, June 3, 2026
6. World Gold Council — Gold ETF Flows: May 2026
7. Silver Institute — World Silver Survey 2026
8. CNBC — Gold Gains After US-Iran Peace Deal, June 15, 2026
9. Federal Reserve — FOMC Minutes, April 28–29, 2026
Disclaimer: This article is for informational purposes only and does not constitute financial or investment advice. Always consult a qualified financial adviser before making investment decisions.
You May Also Like:
- Iran Peace Deal Sends Oil Down 5%, Gold Up 3%
- Gold & Silver Surge on Iran Peace Deal — Then Pull Back
- Silver Fell 22% in 30 Days. Gold-Silver Ratio Hits 63.
- Every Bearish Catalyst Landed at Once. Gold and Silver Went Up Anyway.
- Gold at Seven-Month Lows: Why Geopolitical Fear Is Not Enough
- Gold Slides to $4,130 as Iran War Turns Inflation Against It
- May CPI Printed 4.2%. Core Inflation Beat. So Why Did the Gold Price Drop?
- Gold Is Down 9%. The CPI Print That Could Either Extend the Drop — or End It.
- Gold Price News: Goldman, China, CPI, and the Fed Explained
- Gold Near $4,330 as Rate-Hike Bets Hit 70% and China Acts