Silver Rises Over 120% YTD




Published: 08-17-2026, 12:16 pm | Updated: 08-17-2026, 02:31 pm
J.P. Morgan’s commodities team published a demand warning for silver last week. The bank’s analysts noted that China and India — the world’s two largest silver-importing markets — are both pulling back. China is burning through stockpiles it built ahead of a photovoltaic export tax change. India raised import duties to protect its foreign exchange reserves. If you read that headline alone, you might expect silver to be down today.
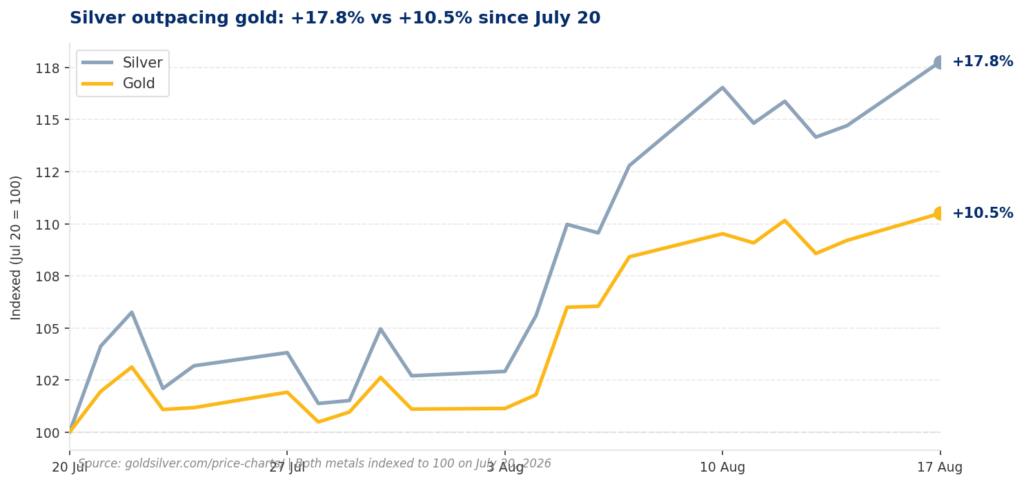
Instead, silver is up more than 2.5%, outpacing gold by more than two to one. Two separate mechanisms explain the move — and understanding them separates holders who get rattled by institutional warnings from those who stay grounded.
What Is Firing Silver’s Monetary Engine Today?
The US Dollar Index fell for the third consecutive session on Monday, touching its weakest level since mid-May 2026. The dollar’s three-day retreat traces directly to last Friday’s retail sales report. July retail sales fell 0.6% — the first monthly decline in nine months and the largest drop since May 2025. Analysts had expected a gain of 0.1%.
That miss matters because it changes the Federal Reserve’s September calculus. Before last week’s data, markets priced roughly a coin-flip chance of a September rate hike. By Friday afternoon, CME FedWatch put those odds at roughly 30 to 35%. A weaker Fed posture means a weaker dollar, which in turn reduces the opportunity cost of holding non-yielding assets like gold and silver and makes both metals cheaper for international buyers.
Consequently, gold is up roughly 1% today. Silver, however, is moving faster — because silver does not run on just one engine.

The Edge Every Investor Needs Smarter precious metals investing starts here. The Nuggets Newsletter brings you essential market insights, Fed updates, global trends, educational videos, and much more.
What Is Firing Silver’s Industrial Engine at the Same Time?
The most recent ISM Manufacturing Index reading came in at 55.6 — a four-year high, marking seven consecutive months of expansion above the 50-point growth threshold.
Silver benefits from this signal in a way gold simply does not. Roughly 58% of annual global silver demand is industrial, according to the Silver Institute’s World Silver Survey 2026. Electronics, solar panels, electric vehicles, and AI data center components all consume silver directly. When the manufacturing sector expands, consumption of these products rises — and silver demand rises with it.
Both engines are firing at the same time today. That combination is unusual, and it is why silver is outperforming gold by more than two to one.
Why Does JP Morgan’s Warning Not Break the Thesis?
JP Morgan’s Gregory Shearer identified two genuine headwinds. In China, strong March silver imports reflected front-loading of demand ahead of the removal of an export VAT rebate on photovoltaic products from April 1. After that policy change took effect, a destocking phase began. Meanwhile, in India, higher import duties and tightened foreign exchange restrictions reduced silver import appetite. Both headwinds are real.
However, they are also near-term and policy-driven — not structural.
The silver market is in its sixth consecutive annual supply deficit, according to the Silver Institute’s World Silver Survey 2026. The 2026 shortfall is projected at 46.3 million troy ounces. Since 2021, when the deficit run began, the cumulative drawdown from above-ground inventories totals approximately 762 million troy ounces. No government can print silver to close that gap.
China’s destocking phase reflects a demand pattern that shifted around a tax deadline, not a collapse in solar ambitions. India’s restriction is a foreign exchange management decision that can reverse. Both headwinds are policy-driven. The supply deficit is not.
What Should Silver Holders Watch Next?
Two events dominate the rest of August. The FOMC minutes from the July 28 to 29 meeting drop Wednesday, August 19. That meeting produced a 9-to-3 hold — three regional presidents voted to hike immediately — so the minutes will reveal how deep the hawkish dissent runs and whether the majority is hardening toward September.
Then, Fed Chair Kevin Warsh delivers the keynote at the Jackson Hole symposium on Friday, August 28 — his first address since taking office on May 22. Because Warsh has removed forward guidance from the Fed’s communication framework, the speech carries more information value than comparable remarks would have under his predecessor. Any signal toward a September hike would tighten monetary conditions and put near-term pressure on both metals.
The structural deficit does not change on the basis of a single Fed speech. Holders who understand the mechanism — rather than just the price move — are equipped to read that response correctly when it arrives.
As of Monday, silver trades at roughly $66.36 per ounce and gold at roughly $4,421, according to goldsilver.com/price-charts/. The gold-silver ratio stands near 66.6, compressing from 67.65 on Friday and sitting close to its 50-year historical average of approximately 65.
Two engines. One structural deficit. A ratio near its historical average. JP Morgan’s warning is worth reading. So is the math behind what it does not change.
Stay On Top of Gold & Silver Prices
Get important market alerts sent straight to your inbox.
SOURCES
1. Silver Institute — World Silver Survey 2026 (April 15, 2026). Global silver supply-demand balance, sixth consecutive annual deficit, 46.3 Moz shortfall. silverinstitute.org
2. J.P. Morgan Commodities Research (Gregory Shearer) — Silver Price Forecast 2026, China and India demand assessment. jpmorgan.com
3. US Census Bureau — Advance Monthly Retail Trade Survey, July 2026 (released August 15, 2026). Retail sales -0.6% MoM. census.gov
4. CME Group — FedWatch Tool, September 2026 FOMC rate decision probabilities, August 17, 2026. cmegroup.com
5. Institute for Supply Management — Manufacturing ISM Report On Business, most recent reading (55.6, 4-year high). ismworld.org
6. GoldSilver — Live Gold and Silver Spot Prices, August 17, 2026. goldsilver.com/price-charts/
7. Federal Reserve — FOMC Statement, July 29, 2026. federalreserve.gov
Disclaimer: This article is for informational purposes only and does not constitute investment advice. Past performance is not indicative of future results. Always consult a qualified financial advisor before making investment decisions.
You May Also Like:
- Gold Needed One Thing to Break $4,400. It Just Got Five of Them.
- Zero Tankers Crossed Hormuz on Sunday. Oil Hit $89. Gold Barely Moved.
- Gold Rebounds to $4,392 as Sentiment Crashes to 51 and Inflation Expectations Rise
- Gold Price and the September Fed Pivot: Five Data Prints Rewrote the Odds This Week
- The Fed’s September Math Just Changed. Here’s What It Means for Gold.
- Jackson Hole Is 14 Days Away. What Warsh Says Could Move Gold More Than Any Inflation Print.