Silver Rises Over 120% YTD




Published: 08-21-2026, 09:44 am
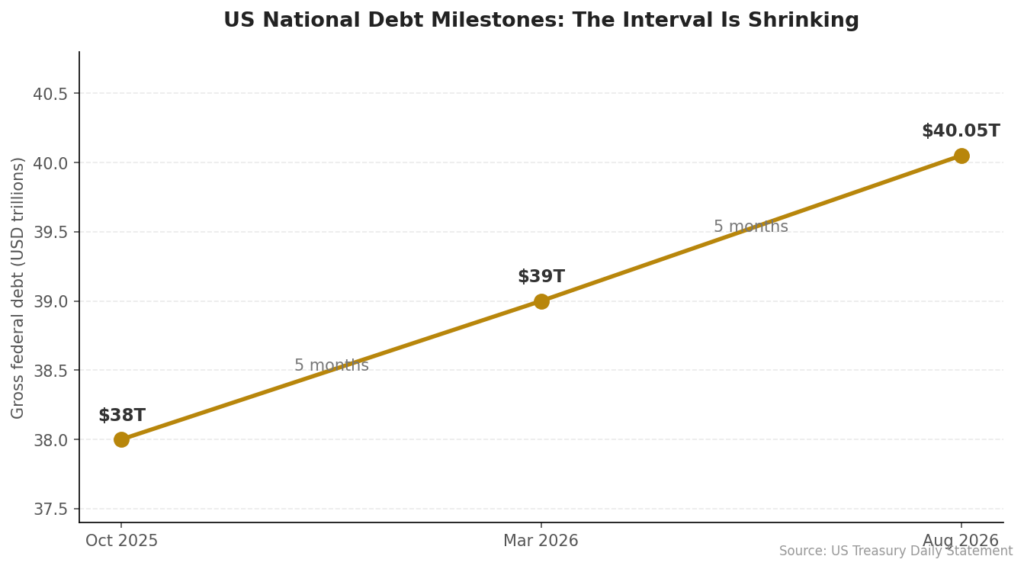
America’s national debt passed $40 trillion on Tuesday, August 18. It had crossed $39 trillion only five months earlier, and $38 trillion five months before that. Three days later, one of Wall Street’s most widely read strategy notes pointed at that arithmetic and turned bullish on gold.
Gold trades at $4,581.95 an ounce this Friday morning, up 1.39% and holding its highest level since early June. Silver has added 1.94% to $69.43, after touching $70 overnight. Notably, the gold-silver ratio sits at 65.99, almost exactly its long-run average of roughly 65:1.

The Edge Every Investor Needs Smarter precious metals investing starts here. The Nuggets Newsletter brings you essential market insights, Fed updates, global trends, educational videos, and much more.
What Did Jefferies Say About Gold?
Jefferies turned increasingly bullish on gold in the latest edition of GREED & fear, the weekly strategy note written by Chris Wood. Specifically, the bank named three drivers: deteriorating public finances in the United States and Japan, less central bank room to respond, and rising cash generation at gold miners.
The national debt numbers carry the argument. Jefferies flagged a July federal deficit of $432 billion, the largest monthly shortfall since March 2021 and a record for any July. Meanwhile, the deficit for the first ten months of fiscal 2026 has reached $1.799 trillion, against $1.775 trillion for all twelve months of fiscal 2025.
That crossover deserves an asterisk. Because August 1 fell on a Saturday, roughly $99 billion of August benefits landed in July instead, and Treasury’s adjusted ten-month figure is $1.700 trillion. In short, the gap is real and widening, but it has not formally overtaken a full prior year yet.
How Does the National Debt Affect the Gold Price?
The link runs through the Treasury market rather than through inflation. More debt means more bonds to sell, and consequently buyers demand higher yields. This week they got them. The 30-year Treasury yield reached its highest level in roughly 19 years on Tuesday. The Treasury Department responded on Wednesday, doubling its buyback ceiling from $2 billion to at least $4 billion per operation.
That response held for about a day. Yields fell, then erased the decline just as quickly. By Thursday the 30-year had returned to roughly where it sat before the announcement, and it has not retreated since, which extends the pattern we traced in our August 19 look at gold rising despite rising yields.
Here is why the national debt and gold tend to move together. Higher yields raise the government’s own interest bill. Interest already consumed 18.5% of federal revenues in fiscal 2025, the highest share since the data series began in 1940, and the Congressional Budget Office projects 18.6% for fiscal 2026. Ultimately the Federal Reserve cannot raise rates far enough to defend the currency without making that bill harder to carry. Economists call the resulting bind fiscal dominance, and gold sits outside it.
Why Are Gold Miners Now Outearning the S&P 500?
The least discussed number in the note is also the most measurable. The Philadelphia Stock Exchange Gold and Silver Index now yields 3.74% on free cash flow. By contrast, the S&P 500 yields 2.67%.
As recently as mid-2023 that index returned negative 2.01%, and in October 2023 the gap against the S&P 500 stood at negative 584 basis points. Miners were burning cash while the index generated it. Since then the relationship has flipped, because the gold price climbed faster than mining costs did. Notably, that 3.74% has eased from 5.07% at end-July, since share prices rallied faster than the cash flows behind them.
Is the Fiscal Case for Gold Actually New?
Not entirely. Investors have pointed at the national debt for decades, often far too early. Jefferies itself did not put the metal first. Instead, the note ranked oil and energy equities as the better hedge, with gold second, largely because of the Strait of Hormuz.
Still, the framing has shifted. The bank built its case on arithmetic that has already happened rather than on a forecast about the next Fed meeting. That said, a bank turning bullish is a signal about sentiment, not a promise about price.
What Does a $40 Trillion National Debt Mean for Savers?
Here is the part worth keeping. It is not the total. It is the interval.
The national debt needed roughly two centuries to reach its first trillion, which it did in 1981. It added the most recent trillion in five months, and the one before that in five months as well. Those increments keep arriving faster while the interest bill compounds. Consequently, the government’s realistic choices narrow to three: cut spending, raise taxes, or let inflation shrink the real value of what it owes. Historically, governments reach for the third, which is the whole reason what sound money actually means is worth understanding.
Gold does not predict which lever gets pulled. Instead, it measures the currency that lever is priced in. That is not doomsday thinking. That is arithmetic, and it is why a saver holds some.
What Should You Watch Next?
Three dates matter now. First, the Treasury’s larger buybacks begin September 9 and run through November 4. Whether they hold the long end matters more than the announcement did. Second, Fed Chair Kevin Warsh delivers his first Jackson Hole keynote on Friday, August 28. Third, watch $4,604, this session’s high, as gold’s nearest level to clear.
Stay On Top of Gold & Silver Prices
Get important market alerts sent straight to your inbox.
SOURCES
1. ANI — Jefferies Turns Bullish on Gold as US, Japan Fiscal Strains Constrain Monetary Policy
2. US Joint Economic Committee — July Closes with $432 Billion Deficit, Largest Monthly Deficit Since March 2021
3. Peter G. Peterson Foundation — Monthly Interest Tracker and the Current Federal Deficit and Debt
4. CBS News — National Debt Tops $40 Trillion After Doubling in Less Than a Decade
5. Committee for a Responsible Federal Budget — Treasury Confirms $1.8 Trillion Deficit for First 10 Months of FY 2026
6. CNBC — Treasury Announces Upscaled Buyback Operation, and Yields Rebound the Following Session
7. Federal Reserve Bank of Kansas City — Jackson Hole Economic Policy Symposium 2026
8. Jefferies — Christopher Wood, Global Head of Equity Strategy
9. GoldSilver — Live Gold and Silver Price Charts
Disclaimer: This article is for informational purposes only and does not constitute investment advice. Past performance is not indicative of future results. Always consult a qualified financial advisor before making investment decisions.
You May Also Like:
- Gold Fell and Silver Rose on the Same Report. Here Is the Mechanism.
- Trump Declared Economic War on Iran. Gold Barely Blinked. Here’s Why.
- Gold’s Pullback Isn’t About ETFs. It’s About a Treasury Buyback.
- The Fed Just Confirmed a 9-3 Split. Then It Said Something Bigger.
- Gold and Silver Are Climbing Today. The Textbook Says They Shouldn’t Be.
- Gold Jumped 1.9%. Silver Jumped 2.7%. The Fed Hasn’t Said a Word Yet.