Silver Rises Over 120% YTD




Published: 08-18-2026, 02:10 pm | Updated: 08-18-2026, 02:12 pm
Gold fell 1.1% to about $4,369 an ounce by midday Tuesday, August 18, 2026, even as the 30-year Treasury yield topped 5.33% and set a 19-year high. Real yields explain the gap. Long-term borrowing costs climbed while expected inflation held near 2.3%, so the after-inflation return on cash improved.
Investors demanded more to lend the US government for 30 years than at any point since 2007. Meanwhile, their inflation forecast for the next decade barely moved. That combination is the whole story.
Silver fell harder, down 2.7% to $64.00, widening the gold-silver ratio from 67.1 Monday to 68.3.
What Happened in the Bond Market on Tuesday?
That 5.33% print beat every level since 2007. The yield traded near 5.32% through the morning, according to CNBC. Ten-year notes yielded 4.732%, and two-year notes yielded 4.186%.
The trigger was fiscal. Treasury reported a July deficit of $432.3 billion, the largest single month since March 2021, though roughly $99 billion reflected August benefits paid early. Fiscal-year borrowing now sits near $1.8 trillion, already above all of fiscal 2025. Notably, global borrowing costs hit multidecade highs too.

The Edge Every Investor Needs Smarter precious metals investing starts here. The Nuggets Newsletter brings you essential market insights, Fed updates, global trends, educational videos, and much more.
Why Did Gold Fall While Treasury Yields Rose?
The yield that matters to gold is the real yield, not the nominal one.
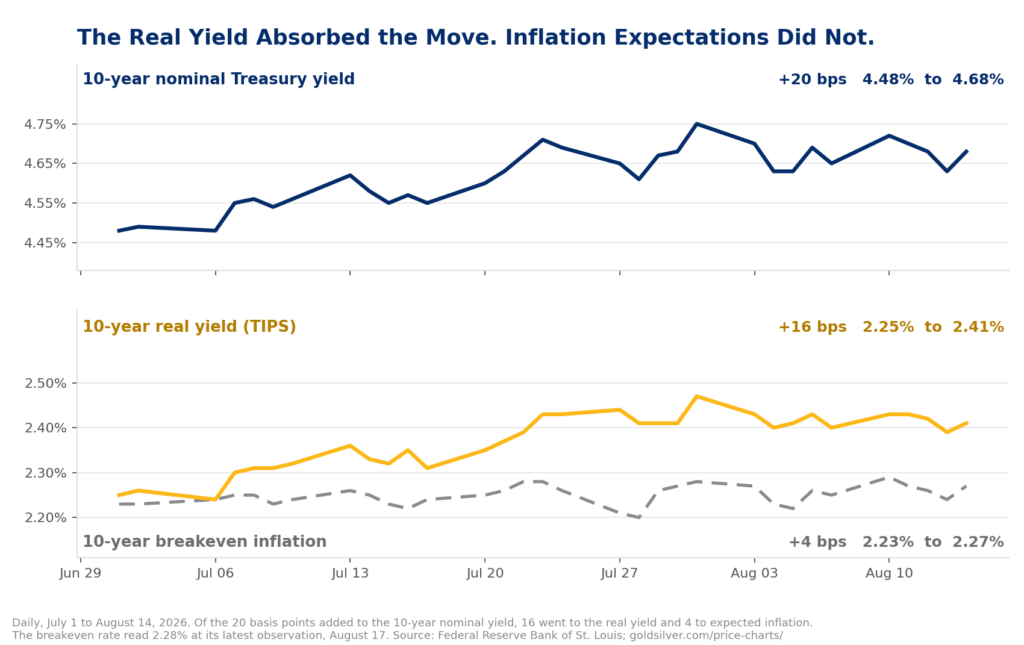
The 10-year breakeven rate, the bond market’s own inflation forecast for the coming decade, sat at 2.28% on August 17, according to the Federal Reserve Bank of St. Louis, essentially flat all week. Meanwhile, the 10-year real yield, read from inflation-protected Treasuries, reached 2.41% on August 14.
Since July 1, the 10-year nominal yield has risen 20 basis points, from 4.48% to 4.68%. Breakeven inflation rose 4 of those. The real yield absorbed the other 16, climbing from 2.25% to 2.41%.
PIMCO, regressing gold against real yields from 2004 to 2025, found a 100-basis-point rise historically cost gold roughly 18% of its inflation-adjusted price. The World Gold Council flags 2.5% as the level where holding gold gets expensive. We sit 9 basis points below it.
One caveat. That relationship partly decoupled across 2024 and 2025, because central bank buying replaced ETF flows as gold’s marginal buyer. Real yields still set direction over full cycles. They no longer work alone.
Is This an Inflation Story or a Credit Story?
It is a credit story, and the distinction matters.
Economists call the extra yield investors demand for lending long the term premium. It compensates them for duration risk, supply risk, and the chance the borrower’s finances deteriorate. However, it is not a price forecast. Breakevens are the forecast, and breakevens sat still.
The evidence is what the economy did. July retail sales fell 0.6%, and producer prices came in flat. Soft demand and cooling inflation normally pull yields down. Instead, yields rose. So the bond market repriced the borrower, not the price level.
What Are the Fed and Wall Street Saying About Real Rates?
Fed Chair Kevin Warsh made the same point in July. He cited tighter financial conditions as a reason to hold rather than hike, noting that higher nominal and real rates had already tightened conditions on their own. The Federal Open Market Committee then held its range at 3.50% to 3.75% for a fifth straight meeting, on a 9-3 vote. Beth Hammack, Neel Kashkari and Lorie Logan each wanted a hike.
Fundstrat technical strategist Mark Newton told CNBC that long-term yields look likely to reach 5.60% to 5.70%.
What Does the Bear Case Get Right?
More than gold holders would like. At a 2.41% real yield, cash and inflation-protected bonds pay a real return that physical metal does not. Furthermore, if Newton is right and breakevens stay near 2.3%, real yields keep rising and gold keeps facing that headwind.
That case is correct on direction. Still, it is incomplete on cause.
What Does a 19-Year-High Long Bond Mean Over Five Years?
The same fiscal arithmetic pushing real yields up is what weakens the bond as a long-term store of value.
Net interest on the federal debt reached $970 billion in fiscal 2025 and crosses $1 trillion this year, on Congressional Budget Office projections. Interest is set to take 18.6% of federal revenues this year, passing the 1991 record. Higher yields raise the cost of every dollar Treasury rolls over, widening the deficit and forcing more borrowing.
So two ideas hold at once, and both are rational. A Treasury bond is a promise to pay dollars. Gold is the collateral that needs no promise. Rising real yields pay that promise better today. By contrast, the reason they are rising makes it less certain over a decade. That is why central banks bought 289 tonnes of gold last quarter while prices fell.
What Should You Watch Next?
Watch the spread, not the headline yield. July’s meeting minutes arrive Wednesday, August 19, and any sign of a live hike debate moves breakevens first. If the 30-year climbs while breakevens hold near 2.3%, real yields keep rising and metals stay pressured. If breakevens close the gap, the real yield stalls. The 2007 peak was 5.44%. The next rate decision lands Wednesday, September 16.
Stay On Top of Gold & Silver Prices
Get important market alerts sent straight to your inbox.
SOURCES
1. CNBC, 30-year Treasury yield tops 5.33%, new 19-year high on inflation, spending concerns, The 30-year Treasury yield just hit a 19-year high
2. Federal Reserve Bank of St. Louis, 10-Year Breakeven Inflation Rate, 10-Year Treasury Inflation-Indexed Security, 10-Year Treasury Constant Maturity Rate
3. PIMCO, Understanding Gold Prices
4. World Gold Council, Gold Demand Trends Q2 2026: Outlook, Central Banks
5. Peter G. Peterson Foundation, Monthly Interest Tracker, The Current Federal Deficit and Debt
6. Committee for a Responsible Federal Budget, Net Interest Costs Will Double, Again, Over the Next Decade
7. U.S. Bank, Federal Reserve monetary policy and interest rates
8. U.S. Department of the Treasury, Monthly Treasury Statement, July 2026
9. Gold and silver spot prices, goldsilver.com/price-charts/
Disclaimer: This article is for informational purposes only and does not constitute investment advice. Past performance is not indicative of future results. Always consult a qualified financial advisor before making investment decisions.
You May Also Like:
- FOMC Minutes Tomorrow. Jackson Hole in Nine Days. Here Is What Gold Needs From Both.
- Three Fed Officials Voted to Hike. What It Means for Gold.
- Why Is Gold Not Going Up? The Bears Vanished in June
- JP Morgan Just Flagged a Silver Demand Warning. Silver Rose Anyway. Here Is Why
- Gold Needed One Thing to Break $4,400. It Just Got Five of Them.
- Zero Tankers Crossed Hormuz on Sunday. Oil Hit $89. Gold Barely Moved.