Silver Rises Over 120% YTD




Published: 08-31-2026, 03:05 pm | Updated: 09-01-2026, 11:45 am
A bank price target is a dated forecast of where an institution expects an asset to trade by a named date. During 2026, the gold targets travelled further than gold did.
Will gold price go down in 2026? Four banks now put year-end gold between $4,500 and $5,100 an ounce, and gold trades below every one of them at roughly $4,435. Six banks cut a 2026 number during the year, one of them three times. The forecasts moved further than the metal did.
Wells Fargo Investment Institute cut its 2026 gold range to $4,900 to $5,100 an ounce in the week of Monday, August 17, 2026 [TheStreet, August 2026]. Notably, that was its third downward revision of the year. In February the same institute had raised the range to $6,100 to $6,300. The midpoint therefore fell by exactly $1,200 an ounce in roughly six months. Meanwhile, gold itself never travelled that far in either direction. For a long-term holder, that gap measures forecast volatility rather than gold volatility.
Key Takeaways
- Six banks revised a 2026 gold number between June and late August. All six moved down. Others raised targets in the same window, so this is a finding about these six, not the whole market.
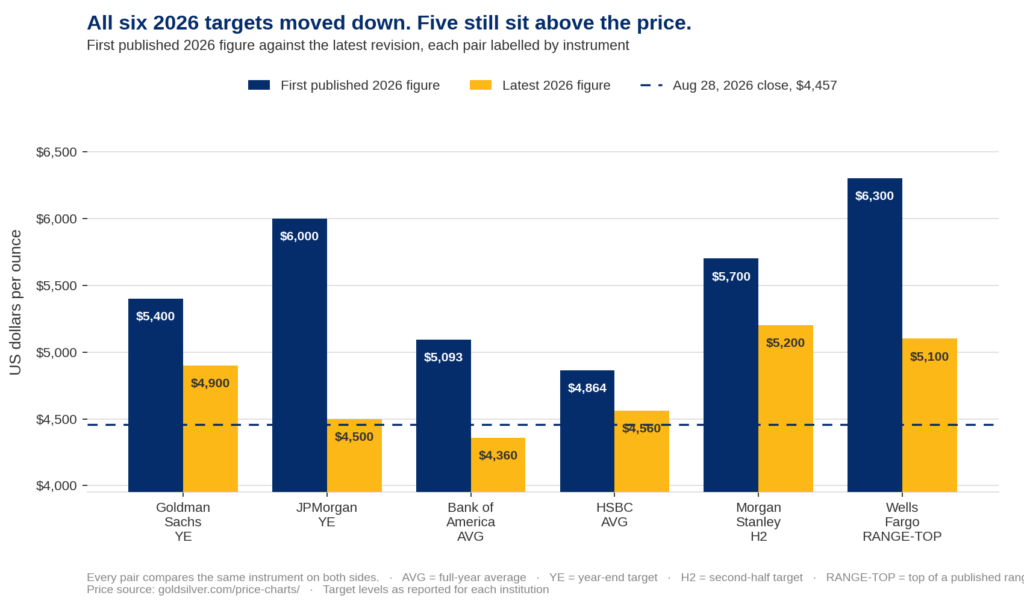
- At roughly $4,435, gold trades below five of the six reduced figures. Against the settled August 28 close of $4,457 it is four of six. In other words, the cuts chased the price and did not catch it.
- The cuts track a changed Federal Reserve outlook rather than a changed view of gold. Goldman Sachs removed all remaining 2026 rate cuts from its forecast when it lowered its target [Bloomberg, June 19, 2026].
- Central banks bought 288.9 tonnes during the second quarter of 2026, the strongest second quarter on record, while the price was falling [World Gold Council, Q2 2026].
- Bank of America’s $4,360 is a full-year average, not a year-end target. Mixing those two is the most common error in target roundups.
That distinction matters more than usual right now. Gold changed hands near $4,435 an ounce on Monday, August 31, 2026, roughly 21% below January’s record [goldsilver.com/price-charts/, August 31, 2026]. Furthermore, the metal gained close to 10% across August. That is measured from the July 31 close to the August 28 close. It then handed back about four and a half percent from its August 25 close. Readers asking whether the decline resumes deserve the mechanism, not another number.
What Happened to Wall Street’s Gold Price Targets in 2026?
Six banks revised a published 2026 gold number between June and late August. The direction was uniformly downward, and the sequence is checkable.
Goldman Sachs cut its year-end 2026 target to $4,900 from $5,400 as reported on Friday, June 19, 2026. Specifically, analysts Lina Thomas and Daan Struyven wrote the note [Bloomberg, June 19, 2026]. Two weeks later, on Friday, July 3, JPMorgan cut its year-end number to $4,500. Its prior path had pointed at roughly $6,000. Furthermore, the bank moved its third-quarter average to $4,300.
Bank of America followed with a note dated Tuesday, July 7, reported the next day [BNN Bloomberg, July 8, 2026]. Crucially, it trimmed the 2026 average forecast by 14% to $4,360 an ounce from $5,093. Michael Widmer heads the bank’s metals research. He attributed the change to a more hawkish Federal Reserve. However, he kept $5,000 in view once tightening ends.
What Did HSBC and Morgan Stanley Do?
HSBC moved on Thursday, July 9, cutting its 2026 average to $4,560 from $4,864 [Reuters, July 9, 2026]. In other words, that is a reduction of $304. Crucially, HSBC held its year-end target near $4,750. It also set a $3,800 to $4,700 range for the rest of the year. Therefore the bank expected gold to spend time near current levels before recovering. That is a different claim from expecting a lower finish.
One institution moved differently. On Thursday, August 20, Morgan Stanley’s Amy Gower wrote that gold had reached the bank’s fourth-quarter forecast of $4,450 faster than expected [Seeking Alpha, August 20, 2026]. She now sees a path above $5,000 during 2027. Notably, that is an upgrade to the 2027 path rather than a raise to the 2026 number.
Which Banks Cut, and by How Much?
| Institution | First published 2026 figure | Latest 2026 figure |
|---|---|---|
| Goldman Sachs | $5,400 year-end target | $4,900 year-end target |
| JPMorgan | roughly $6,000 year-end target | $4,500 year-end target |
| Bank of America | $5,093 full-year average | $4,360 full-year average |
| HSBC | $4,864 full-year average | $4,560 full-year average |
| Morgan Stanley | $5,700 second-half target | $5,200 second-half target |
| Wells Fargo | $6,300 top of published range | $5,100 top of published range |
Why Did the Banks Cut Their 2026 Gold Forecasts?
One mechanism explains most of it: the expected path of US interest rates.
Gold pays no coupon. Consequently, higher policy rates for longer raise the cost of holding a non-yielding asset. Moreover, a stronger dollar compounds it. The same ounce simply costs more for buyers outside the United States. Goldman did not merely mark gold down. Instead, it removed every remaining 2026 rate cut from its Fed forecast. It also pushed first easing out to June 2027. The gold number followed the rates number. Notably, Goldman added that an actual hike would take gold nearer $4,400 by year-end [Mining.com, June 19, 2026].
Read that closely. The banks did not discover something new about gold. They changed their view of the Federal Reserve. Therefore the gold target sits downstream of that view. Compare the targets analysts were publishing in April against today’s set. Consequently, the shift reads as a rates story rather than a metals story
The Knowledge That Changes Everything

Two essential guides — yours free. Understand why gold matters and why fiat currencies always fail.
Will Gold Price Go Down in 2026?
Nobody publishing a target knows, and the revision record is the evidence.
Consider the widest single move. Wells Fargo began 2026 at $4,500 to $4,700. It raised to $6,100 to $6,300 on a February note. Gold sat near $4,961 when that note was written. Nevertheless, by mid-June it had cut to $5,300 to $5,500. Then, in the week of August 17, it cut again to $4,900 to $5,100. Both ends of the 2027 range came down $400 as well. So anyone who anchored to the February number watched that anchor drift $1,200 an ounce.
Meanwhile, gold’s own range was narrower than the forecast range built to describe it. As of late August 2026, spot sits 6.6% below HSBC’s $4,750 year-end target. Furthermore, at roughly $4,435 it sits below five of the six revised figures in the table above, and below four of six measured against the settled August 28 close of $4,457 that the chart uses as its reference line. Gold was briefly above several of them during the week of August 25. All six of the 2026 revisions moved downward. In other words, the cuts chased the price and did not catch it.
By contrast, historical drawdowns give a more useful frame than any target does. It helps to know how deep past gold declines ran and how long they lasted. That record tells you what a 21% pullback means across a holding period measured in years.
What Were Central Banks Doing While the Targets Fell?
Buying, and at a record pace.
The World Gold Council reported official-sector purchases of 288.9 tonnes during the second quarter of 2026 [World Gold Council, Q2 2026]. The Council also sponsors a large gold exchange-traded fund through its trust services arm. Therefore treat it as an interested compiler rather than a neutral one. That figure is the strongest second quarter on record, and the buying happened while the price was falling.
So two groups looked at the same market and did opposite things. Research desks cut numbers on a changed rate outlook. Meanwhile, sovereign buyers added tonnage into weakness. One behaviour is a forecast, the other an allocation. However, only the second commits capital. Reserve managers are not paid to call the next quarter. They hold gold because it carries no counterparty and settles no promise. That is the same reason it has served as money for millennia.
What Does a Revised Price Target Commit Anyone To?
The surface reading is that lower targets mean lower conviction. That reading is incomplete.
Look at what did not change. Bank of America kept $5,000 in view. Similarly, HSBC held its year-end target while cutting its average. Wells Fargo cut a ceiling and stayed favourable. Morgan Stanley raised its 2027 path. Specifically, each one cut the expected speed and kept the direction. That is a statement about the Federal Reserve rather than about gold.
Now go around the second corner. A price target is an unfunded opinion. It has no expiry date and no cost of being wrong. Therefore the analyst revises and moves on. The holder, by contrast, carries the position through every revision. That asymmetry is why a target makes a poor foundation for a plan. It reads sentiment well, and it schedules nothing.
Which sets up the question the revisions cannot touch. If the number is unknowable, only the decisions that ignore it remain. How much you hold, in what form, and where it sits.
What Does This Mean for Gold Investors?
It means the forecast is the least durable input available to you. Instead, build on the parts that hold still.
Position size holds still. So does form. An ounce held in allocated, titled storage carries no revision history and no counterparty. By contrast, paper exposure to the same price carries both. That gap is worth knowing before the next target lands. The practical differences between where the metal sits are mechanical, not abstract. Finally, for metal held toward retirement, the custody rules inside a retirement account set the boundaries before any price question arises.
None of that requires a view on the fourth quarter. That is the point.
Stay On Top of Gold & Silver Prices
Get important market alerts sent straight to your inbox.
People Also Asked
No published forecast can answer that with confidence. The 2026 record shows why. Four banks put year-end gold between $4,500 and $5,100 an ounce. All four sit above the roughly $4,435 gold trades at in late August 2026. However, every one of the numbers was revised during the year. Wells Fargo Investment Institute revised three times [TheStreet, August 2026]. A target says what a bank expected on the day it was written. As a result, it carries no commitment to a timeline.
Wells Fargo Investment Institute holds the highest published year-end range. It sits at $4,900 to $5,100 an ounce, set in the week of August 17, 2026. Goldman Sachs is just below at $4,900, cut from $5,400 on June 19. For 2027, Wells Fargo publishes $5,400 to $5,600. Similarly, Morgan Stanley’s Amy Gower has described a path above $5,000. Each is a revised number, not an original.
Because most of them are rate forecasts wearing a gold label. Gold pays no income. Therefore its appeal moves with the expected path of interest rates and the dollar. When Goldman Sachs pushed its first expected Fed cut from 2026 to June 2027, the gold target moved with it. As a result, a revision to the rate view produces a revision to the gold number. Notably, rate views change several times a year.
No, and the distinction is practical. Bank of America cut its 2026 average by 14% while keeping $5,000 in view once tightening ends. Similarly, HSBC cut its average and held its year-end target near $4,750. Wells Fargo lowered a ceiling and stayed favourable on the metal. In each case the bank cut the expected speed of the rise. However, none of them reversed its direction.
Gold traded near $4,435 an ounce on Monday, August 31, 2026 [goldsilver.com/price-charts/, August 31, 2026]. That is roughly 21% below the record set in January. Measured differently, the metal gained close to 10% across August. That runs from the July 31 close to the August 28 close. It then gave back about four and a half percent from its August 25 close. Both figures describe the same market, and they answer different questions.
Focus on the inputs that do not move with the forecast. Position size, the form of ownership, and the custody setup are decisions a holder controls. Crucially, none of them requires a fourth-quarter price view. Central banks showed the way during the second quarter of 2026. They added 288.9 tonnes into a falling price, the strongest second quarter on record [World Gold Council, Q2 2026]. In short, they treated gold as an allocation rather than a trade.
SOURCES
1. Bloomberg — Goldman Sachs Lops $500 Off Gold Target on No Fed Cuts This Year, June 19, 2026
2. Mining.com — Goldman Cuts Gold Price Forecast Down to $4,900, June 19, 2026
3. BNN Bloomberg — BofA Cuts 2026 Average Gold Forecast, Sees Long-Term Upside, July 8, 2026
4. MarketScreener — BofA Cuts 2026 Average Gold Forecast, Sees Long-Term Upside, July 8, 2026
5. GoldSilver — HSBC Cut Its Gold Forecast by $304. Then Said Gold Will Hit $4,750 by Year-End, citing Reuters, July 9, 2026
6. Seeking Alpha — Gold Could Top $5,000 by Next Year, Morgan Stanley Says, August 20, 2026
7. TheStreet — Wells Fargo Revamps Gold Price Target for the Rest of 2026, August 2026
8. TheStreet — Wells Fargo Resets Gold Price Target for the Rest of 2026, March 28, 2026
9. World Gold Council — Gold Demand Trends Q2 2026, Central Banks, July 30, 2026
10. GoldSilver — Gold & Silver Spot Prices, August 31, 2026
Disclaimer: This article is for informational purposes only and does not constitute investment advice. Past performance is not indicative of future results. Always consult a qualified financial advisor before making investment decisions.
You May Also Like:
- SLV Holds Your Silver. It Just Can’t Give It Back to You.
- What Are the IRS Rules for a Precious Metals IRA in 2026?
- Why Your Pension Can Own Gold and Your 401(k) Still Can’t
- Ten Percent Sent Gold Abroad. Nine Percent Brought It Home.
- Permanent Portfolio: Harry Browne’s 25% Gold Rule
- Australian Gold Kangaroo: The Bullion Coin Backed by an Act of Parliament
- What Is Sound Money? Why the Dollar Lost 87% of Its Value Since 1971
- Vault Storage vs. Gold ETFs: Who Owns the Gold You Paid For?
- Silver Price Outlook August 2026: Down 47% and Barely Owned