Silver Rises Over 120% YTD




Published: 08-14-2026, 03:12 pm | Updated: 08-14-2026, 04:58 pm
Key Takeaways
- Gold is trading near $4,380 today, up roughly 10% from its early-August low near $4,000 — the largest monthly gain since January’s record run, according to [goldsilver.com/price-charts/].
- Three data prints in one week flipped the September rate-hike calculus: July jobs fell 23,000 against a Dow Jones consensus of +83,000; July CPI came in at 3.4% year-over-year — a second consecutive monthly deceleration; and July PPI was flat, below analyst estimates. September hike probability fell from roughly 50% to approximately 31% [CME FedWatch].
- Central banks bought 288.9 tonnes of gold in Q2 2026 — a quarterly record, up 62% year-over-year — while gold was falling. That structural buying at declining prices provides the floor this rally is building from [World Gold Council].
- The next decisive event: August CPI releases on September 10, and the Federal Open Market Committee meets September 15–16. Those two prints will determine whether the August rally extends or reverses.
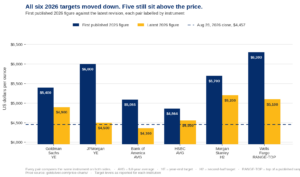
- Major institutions have revised their year-end targets down from January highs, but Goldman Sachs ($4,900), JPMorgan ($4,500 Q4), and Bank of America ($4,360) all still sit above current prices.
Gold entered August near $4,000. As of August 14, it is trading near $4,380 [goldsilver.com/price-charts/] — on course for its strongest monthly gain since January’s record run.
This is the third installment in our monthly Gold Price Outlook series. In June and July, we examined why gold corrected nearly 25% from its all-time high and why the structural case remained intact. August is different. A single week delivered three economic data points that shifted the Federal Reserve’s calculus, compressed rate-hike expectations, and drove gold through a ten-week high. Here is what happened — and what it means for your metals.
Why Did the Gold Price Rise in August 2026?
The answer has a single root cause and three branches.
The Root Cause: Real Yields
The root cause is real yields. Because gold pays no interest, it competes directly with yield-bearing assets. When investors expect the Federal Reserve to raise rates, real yields rise. Bonds and money-market funds become more attractive relative to gold. When rate-hike expectations compress, the competition eases. Gold is nearly a pure monetary asset — roughly 90% of annual gold demand is store-of-value, reserve, and jewelry purchases. That makes it maximally sensitive to any shift in real rate expectations.
Three consecutive data releases compressed those expectations significantly.
The Three Prints That Moved the Market
Branch one: the jobs report. On Friday, August 7, the Bureau of Labor Statistics reported that the US economy shed 23,000 nonfarm payroll jobs in July. The Dow Jones consensus had forecast a gain of +83,000. That 106,000-job swing was one of the largest July misses in recent memory. The BLS also revised June down to a loss of 20,000 jobs and cut May by 66,000 to just 63,000. The trailing 12-month average for monthly job creation fell to 34,000 — a pace consistent with an economy treading water. For a detailed explanation of the mechanism connecting payroll data to gold, see the exact mechanism connecting jobs data to gold.
A Federal Reserve that cannot point to a robust labor market faces a harder case for raising rates. September hike odds on the CME FedWatch tool fell immediately after the release.
Branch two: July CPI. On Wednesday, August 12, the Bureau of Labor Statistics confirmed that consumer prices rose just 0.1% in July. The annual rate came in at 3.4%, down from 3.5% in June. Core CPI, which strips out food and energy, rose 0.2% monthly and 2.5% annually. Both readings were in line with the Dow Jones consensus. This was the second consecutive month of slowing inflation — the first sustained cooling after months of Iran-conflict-driven energy price acceleration. Gold gained as traders priced in a hold at September.
How PPI Sealed the Case
Branch three: July PPI. On Thursday, August 13, wholesale prices came in flat for July — unchanged month-over-month — with an annual rate of 4.7% [BLS]. The core PPI measure excluding food and energy rose 0.2% monthly and 4.2% annually, below the Dow Jones consensus of 0.3% and 4.9% respectively. One nuance worth noting: the broader core measure stripping out food, energy, and trade services rose 0.4% in July. That measure feeds most directly into the Fed’s preferred PCE gauge. The acceleration was driven largely by a 6.5% spike in portfolio management fees — partly a timing artifact. The headline number, however, is what moved September rate-hike pricing. Additionally, June’s headline PPI was revised upward from −0.3% to −0.1%. That revision makes the “soft June” story less clean than it initially appeared. A flat headline PPI reading, following June’s revised −0.1% decline, reinforces the argument that the energy-driven surge earlier this year is fading.
Together, the three prints moved September rate-hike odds from roughly 50% to approximately 31% as of August 14, per the CME FedWatch tool. Gold responded accordingly. After trading near $4,000 in early August, it hit an intraday high of $4,509 on August 13 before settling back to the $4,380 range.
That is how the FOMC minutes moved gold this week — and why.
The Knowledge That Changes Everything

Two essential guides — yours free. Understand why gold matters and why fiat currencies always fail.
Are Central Banks Still Buying Gold in 2026?
Yes. Their behavior in the second quarter is arguably the most important structural data point in this entire article.
On July 30, the World Gold Council published its Gold Demand Trends report for Q2 2026. Central banks purchased a net 288.9 tonnes of gold during the quarter. That is a 62% increase from the 177.9 tonnes purchased in Q2 2025. It is also the strongest second-quarter total in the WGC’s historical data series [World Gold Council].
The timing of this buying deserves attention. Q2 2026 was the quarter when gold recorded its steepest price decline since 2013. Prices fell sharply from January’s highs. Central banks responded by buying more, not less. Reserve managers do not trade gold the way short-term investors do. For a central bank, gold is a structural reserve asset, not a tactical position. Lower prices represent an opportunity to accumulate at reduced cost — not a signal to exit.
Who Was Buying — and Who Was Selling
Poland led the buying with 51 tonnes in Q2, bringing its first-half total to 82 tonnes. The country is working toward a self-established target of 700 tonnes. The People’s Bank of China added 33 tonnes — its largest single-quarter purchase since late 2023. Bloomberg reported on August 7 that the PBoC has now accumulated gold for 21 consecutive months. Uzbekistan, Kazakhstan, Jordan, and the Czech Republic also added material amounts.
On the sell side, Russia reduced its holdings by 22 tonnes. Turkey, the largest seller in Q1, slowed its unloading to just 4 tonnes. The net result: Q2 2026 set a record for second-quarter central bank demand.
Total H1 2026 central bank purchases reached 345 tonnes. That figure is lower than the prior year’s first-half pace, reflecting Q1 weakness, but the acceleration in Q2 was sharp. Meanwhile, gold ETF investors recorded 45 tonnes of net outflows during the quarter, primarily in North American markets. However, gold-backed ETFs have begun reversing course. SPDR Gold Trust recorded approximately $637 million in net inflows on August 7 alone.
The structural picture is this: central banks are buying gold at a quarterly record pace precisely during the period when individual investors were selling. That asymmetry — sovereign accumulation at lower prices while retail exits — is the structural floor underneath this month’s rally.
What Does the September FOMC Meeting Mean for Gold?
The Federal Reserve’s September 15–16 meeting is the most consequential near-term event for gold. Here is what each scenario means.
If the Fed holds rates steady at 3.50–3.75% — the outcome currently assigned roughly 69% probability on CME FedWatch — real yield expectations ease further. That removes the primary headwind for gold. In this scenario, gold has a clear runway toward institutional targets: Goldman Sachs at $4,900, JPMorgan at $4,500 for Q4, and the WGC’s base-case fair value range of $3,895–$4,305. The momentum from August’s three-print week would be confirmed rather than reversed.
If the Fed raises rates by 25 basis points to 3.75–4.00% — the outcome assigned roughly 31% probability — the calculus shifts. Higher real yields compress gold’s upside. The July meeting’s 9-3 vote to hold included three dissenters who favored an immediate hike. All three have since reiterated that stance publicly. The September meeting will also include an updated dot plot — the first with all 18 active participants contributing. Fed Chair Kevin Warsh did not submit his projection at the June meeting.
What Decides the Outcome: August CPI on September 10
The variable that decides between these scenarios is not yet on the table. It arrives on September 10. That is when the Bureau of Labor Statistics releases August CPI data. That single print, arriving five days before the FOMC convenes, will carry the decisive weight. A reading above 3.5% reanimates the hike case. A reading at or below 3.4% cements the hold.
The WGC’s Gold Mid-Year Outlook “Point Break” placed base-case fair value at approximately $4,100, with a tolerance band from $3,895 to $4,305. That assumed one hike and inflation peaking near 3.9% [World Gold Council]. Gold is currently trading above that fair-value midpoint. That premium reflects the market’s reading of this week’s three prints: the hike scenario may be receding.
What Is the Gold Price Forecast for the Rest of 2026?
Institutional forecasters revised their targets significantly from January’s highs, but the majority remain above current prices.
Goldman Sachs lowered its year-end gold target to $4,900 in June, down from an earlier forecast of $5,400. It also shifted its expectation for the first rate cut from 2026 to 2027. JPMorgan moved to a Q3 2026 average of $4,300 and a Q4 target of $4,500, down from a prior path that had targeted $6,000. Bank of America cut its 2026 average gold price forecast by 14% to $4,360 in early August.
All of these revised targets remain above gold’s current price of approximately $4,380 [goldsilver.com/price-charts/]. The direction of the institutional thesis has not changed. The pace expectation has.
Three Structural Pillars Supporting Gold into Year-End
The structural argument for gold in the remainder of 2026 rests on three pillars.
First, the interest rate ceiling. The US federal debt load above $39 trillion means every 25 basis point rate rise adds materially to annual interest expense. Net interest payments already reached $628 billion in the first seven months of FY2026 — surpassing Medicare spending of $588 billion for the same period. Interest also exceeded the full defense budget on a full-year basis in FY2025. The CBO projects net interest will hit $1.039 trillion for full-year FY2026, consuming more than $3 billion every day [Congressional Budget Office]. Only Social Security is currently larger. This does not stop the Fed from hiking. But it constrains how far and how long any tightening cycle can persist.
The Demand Floor and the Correction Precedent
Second, the central bank demand floor. Q2’s record-setting buying at declining prices shows that sovereign reserve managers are not deterred by short-term price weakness. The WGC’s survey of 76 central banks found that 45% intend to increase their gold reserves over the next 12 months [World Gold Council]. That structural demand does not respond to short-term price signals the way ETF flows do.
Third, the correction context. Gold fell from its January all-time high of $5,589.38 to a June low near $3,963. That mirrors prior bull market corrections. The 2008 selloff reached -29% before the subsequent run to $1,900. The March 2020 COVID correction hit -12% before gold reached its prior all-time high of roughly $2,075 in August 2020. In both cases, the correction marked the beginning of the next advance, not the end of the bull market. Gold mine supply has also grown at less than 1% annually over the past decade, according to the World Gold Council — a rate that trails money supply creation.
What Should Gold Holders Watch in the Weeks Ahead?
The calendar through mid-September shapes the near-term outlook. The August CPI release on September 10 is the decisive input for the September 15–16 FOMC. Between now and then, the Jackson Hole Symposium (August 21–23) gives Fed officials an opportunity to signal their September intentions. Markets will parse every phrase.
What This Means for Physical Gold Holders
For physical gold holders, the short-term rate decision matters less than the structural trajectory. June and July’s installments of this series were about maintaining conviction during a correction. August’s thesis is about understanding what just ended that correction — and why the structural case remains intact on the other side.
Gold is a monetary asset. It does not pay interest. It is therefore most valuable when monetary conditions are uncertain — when inflation compresses the real return on cash and bonds, when central banks rebalance away from dollar-denominated reserves, and when the structural cost of fiat expansion rises. August’s three-print week did not change that long-term environment. It changed the near-term rate pricing within it.
If you hold physical gold through a trusted custodian with institutional-grade storage, the August data reinforces your allocation thesis. If you are evaluating your first allocation, the current price sits above the WGC’s fair-value midpoint but well below January’s all-time high. That reflects a market repricing a tighter monetary environment — not a structural reversal.
Stay On Top of Gold & Silver Prices
Get important market alerts sent straight to your inbox.
People Also Ask
What is the gold price outlook for August 2026?
Gold entered August near $4,000 and has risen roughly 10% month-to-date to approximately $4,380 [goldsilver.com/price-charts/]. Three consecutive data releases shifted September rate-hike expectations from roughly 50% to approximately 31% on the CME FedWatch tool: the July jobs report, July CPI, and July PPI. The intraday high for August reached $4,509 on August 13.
Why is the gold price rising in August 2026?
Three economic data releases compressed Federal Reserve rate-hike expectations. July nonfarm payrolls fell 23,000 against a Dow Jones consensus of +83,000 and CPI came in at 3.4% year-over-year — its second consecutive monthly deceleration. July PPI was flat, below forecasts. Because gold pays no yield, it rises when real yield expectations fall. Lower hike odds equal lower expected real yields equal higher gold.
What does the September FOMC meeting mean for gold?
The Federal Reserve meets September 15–16. Markets currently assign roughly 69% probability to a hold at 3.50–3.75% and about 31% to a 25-basis-point hike, per CME FedWatch. A hold removes the primary headwind for gold and supports a continuation of August’s rally toward institutional targets in the $4,500–$4,900 range. A hike would pressure gold by raising real yield expectations. The deciding input arrives September 10 with the August CPI release.
Are central banks still buying gold in 2026?
Yes. The World Gold Council reported that central banks purchased a net 288.9 tonnes of gold in Q2 2026 — a 62% increase year-over-year and the strongest second quarter on record — even as gold prices declined sharply [World Gold Council]. Poland, China, Uzbekistan, Kazakhstan, and the Czech Republic were among the largest buyers. The People’s Bank of China has extended its accumulation streak to 21 consecutive months. This structural demand is the floor beneath gold’s current recovery.
What is the gold price forecast for year-end 2026?
Major institutions have trimmed their forecasts from January highs but remain constructive. Goldman Sachs targets $4,900 at year-end. JPMorgan expects $4,500 in Q4. Bank of America projects a 2026 average of $4,360. The World Gold Council’s valuation model places fair value at approximately $4,100, with an upside scenario reaching $4,305 if rate-hike expectations continue to recede [World Gold Council]. All three institutional forecasts sit above gold’s current price of approximately $4,380.
SOURCES
1. Bureau of Labor Statistics — Employment Situation, CPI, and PPI summaries, July 2026: bls.gov
2. World Gold Council — Gold Demand Trends Q2 2026 and Gold Mid-Year Outlook 2026 (July 2026): gold.org
3. CME Group — FedWatch Tool, September 2026 rate probabilities (August 14, 2026): cmegroup.com
4. Federal Reserve Board — FOMC Statement, July 29, 2026: federalreserve.gov
5. Congressional Budget Office — Budget and Economic Outlook, FY2026 net interest projections: cbo.gov
6. GoldSilver — Live gold and silver spot prices: goldsilver.com/price-charts/
Disclaimer: This article is for informational purposes only and does not constitute investment advice. Past performance is not indicative of future results. Always consult a qualified financial advisor before making investment decisions.
You May Also Like:
- 14 Million Coins Sold. Zero Design Changes in 35 Years. Here’s Why Investors Keep Choosing the Philharmonic.
- Two Inflation Numbers Come Out Every Month. The Fed Only Cares About One.
- Why Your Commodity ETF Gives You Almost No Gold — and What That Costs You
- American Gold Buffalo Coin: The Complete Guide to the U.S. Mint’s Purest Gold
- The Fed Printed $7 Trillion. Velocity Kept It Quiet. That’s Changing.
- Most 401(k)-to-Gold-IRA Rollovers Lose 20% Immediately. Here Is Why — and How to Avoid It.
- Gold Just Climbed to a 7-Week High. One Number Changed Everything.