Silver Rises Over 120% YTD




Published: 10-07-2026, 10:43 am
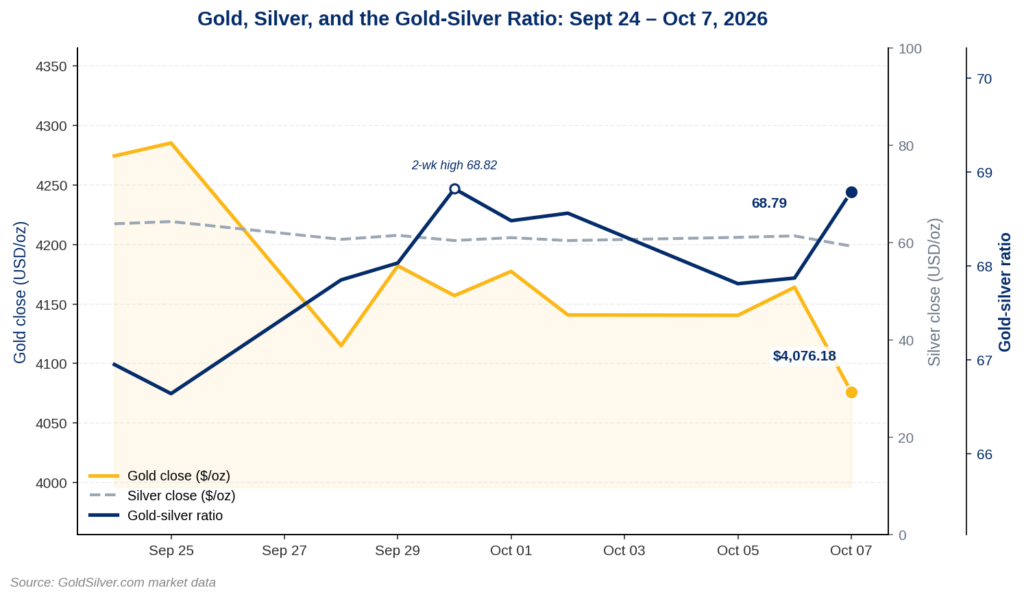
Gold is down 2.15% today, trading at $4,076.18. Silver is down 2.52%, trading at $59.25. That gap looks small. Do the math, though. Silver actually fell about 17% faster than gold did, in percentage terms, in the same session.
The easy explanation is yields. Treasury rates are climbing again. Today’s FOMC Minutes release is due at 18:00 GMT. The 10-year yield is near its highest level since 2002. The 30-year has pushed past 5.70% [FXStreet]. A firmer dollar and higher borrowing costs raise the cost of holding assets that pay no interest. Both metals are feeling that pressure.
But the yields story only explains why gold and silver are both down. It does not explain why silver is down more. For that, look at silver itself, not the bond market.

The Edge Every Investor Needs Smarter precious metals investing starts here. The Nuggets Newsletter brings you essential market insights, Fed updates, global trends, educational videos, and much more.
What Happened to Gold and Silver Prices Today?
Both metals opened lower and kept sliding all morning. Gold’s drop tracks the broader pattern: real yields up, non-yielding assets down. That pattern has driven precious metals for weeks. Silver’s drop outran it.
The gap shows up clearly as a gold-silver ratio divergence. This ratio measures how many ounces of silver it takes to buy one ounce of gold. Still, today’s ratio sits at 68.79, just below the two-week high of 68.82 set on September 30 and well above the 66.64 low from late September. A rising ratio means silver is cheapening faster than gold, ounce for ounce.
Why Is Silver Falling Harder Than Gold Today?
Silver carries a split identity that gold does not share. Specifically, about 58% of global silver demand is industrial, not monetary, according to the Silver Institute’s 2026 World Silver Survey [Silver Institute]. Solar panels, electronics, and grid infrastructure all use physical silver at scale. Gold has no comparable industrial base pulling the other way.
That split cuts both ways today. When real yields spike, silver takes the same monetary-asset hit gold does. On top of that, traders often read higher borrowing costs as a warning sign. They worry capital-intensive buildouts, like solar installation, could slow down. So silver absorbs two separate worries in one move. Gold absorbs only one. Indeed, that combination is a reasonable explanation for silver’s higher-beta reputation showing up again today.
What Does a Rising Gold-Silver Ratio Mean for Investors?
A rising ratio means one thing directly: silver has gotten cheaper relative to gold. It does not mean silver’s fundamentals changed overnight, and it is not usually treated as a verdict on either metal’s long-term case.
Context decides how much that matters. Today’s print of 68.79 sits toward the richer end of this quarter’s range, though it is still inside the ratio’s long-run historical range of roughly 47 to 65. Readings above 80 have historically preceded stretches where silver outperforms gold, so today’s level is elevated but well short of that threshold. Today’s specific move also reflects a real-yield shock working through two metals with different demand structures, not new information about silver’s underlying supply-and-demand balance. The FOMC Minutes release later today could move both metals again, in either direction, once markets see how the Fed described its own rate path.
What Should Investors Watch Next?
Two things matter past today’s session. Watch whether the 10-year yield actually breaks its 2002-era high once the Minutes are out. Watch whether the gold-silver ratio holds above 68 or snaps back toward the 67-handle that held for most of early October.
For individual investors, a widening ratio during a real-yield shock is typically a rebalancing signal. It is not usually a reason to exit either metal. If you already hold both gold and silver, a move like today’s is a natural checkpoint. Has your allocation drifted from your original plan? Is now a sensible moment to adjust the split between the two?
None of this changes the longer structural case. Governments carry record debt loads, and a 10-year Treasury yield near 5.34% makes that debt more expensive to refinance, not less. That pressure keeps building whether gold and silver have a quiet week or a volatile one. Day-to-day divergences like today’s are a tactical question of which metal to hold more of. The multi-year case for holding both, as money that no central bank can create more of by decree, is a separate question entirely.
Stay On Top of Gold & Silver Prices
Get important market alerts sent straight to your inbox.
SOURCES
1. FXStreet — Gold Declines as Stronger US Dollar and Yields Weigh Ahead FOMC Minutes
2. FXStreet — What Is Keeping Silver Stuck at Its Lowest Levels of the Last Two Months?
3. GoldSilver.com — Live Gold, Silver, and Gold-Silver Ratio Spot Pricing
4. Silver Institute — World Silver Survey 2026
Disclaimer: This article is for informational purposes only and does not constitute investment advice. Past performance is not indicative of future results. Always consult a qualified financial advisor before making investment decisions.
You May Also Like:
- Gold Fell 26% From Its Peak. Five Wall Street Voices Just Made the Case for Why That’s the Wrong Read.
- Gold Fell to a Two-Month Low Today. Then It Rebounded Before Lunch.
- Five Moves Are Quietly Rebuilding Gold’s Entire Market Structure
- Gold Is Rising Today. A 24-Year-High Bond Yield Says It Shouldn’t Be.
- Gold’s Share of Central Bank Reserves Nearly Doubled. A Top Banker Just Explained Why.
- Treasury Yields Are Tightening: What It Means for Gold
- Who’s Actually Right About Gold Right Now? Five Signals, Five Answers
- Gold and Silver Are Rising Today. So Is the Dollar. That’s Rare.
- When Should a Central Bank Sell Its Gold? One Just Did. Most Won’t.