
Gold Investment Benefits: Why Smart Investors Act Now

Amid inflation, market shocks, and dollar risks, smart investors are boosting gold allocations. Discover why gold remains the ultimate wealth protection now.
How to Set Up a Precious Metals IRA with GoldSilver

Want to protect your retirement from inflation and market volatility? Learn how to set up a Precious Metals IRA in 5 simple steps—plus expert tips on choosing metals, cutting fees, and securing tax-advantaged storage.
Timeless Wealth: How Gold and Silver Have Anchored Economic Stability for Centuries

Gold and silver have long been more than just coveted metals—they’ve been cornerstones of global commerce and monetary trust. Throughout history, civilizations relied on these metals not only for their beauty but for their unmatched ability to promote economic stability. For those exploring how gold silver economic stability continues to shape modern financial strategies, history offers profound lessons with enduring relevance. Understanding the historical role of gold and silver coinage helps today’s investors and policymakers make sense of a global economy full of volatility. The enduring connection between precious metals and economic stability shows why these assets remain essential tools […]
Elon Musk Threatens New Party as Congress Adds $4 Trillion: Why Gold & Silver Still Win

Remember Ross Perot? The businessman who showed up with charts, warning America about our dangerous debt trajectory? Now Elon Musk is channeling that same energy — but with 10x the influence and a very real threat that could reshape American politics. In the latest episode of The GoldSilver Show, Mike Maloney and Alan Hibbard break down Musk’s explosive tweets about forming “The America Party” and what the just-passed “Big Beautiful Bill” means for your financial future. The $4 Trillion Question On July 1st, the Senate passed what might be the most fiscally irresponsible bill in American history. The numbers are […]
The Senate Just Added $3.3 Trillion to the Tab. Are You Ready?

New Senate bill adds $3.3T in debt — just as the U.S. dollar posts its worst start to a year since 1973.
Can Stablecoins Save the Dollar? Why Central Banks Are Betting on Gold Instead

The financial world is witnessing an unprecedented shift. Professional traders are shorting the U.S. dollar at levels not seen in 20 years, while central banks buying gold at record rates signal a deeper loss of confidence in fiat currency. In a recent episode of The GoldSilver Show, Mike Maloney and Alan Hibbard dissect this dramatic transformation and expose why the Treasury’s proposed “stablecoin solution” may be nothing more than wishful thinking. Everyone’s Betting Against the Dollar—But Should They Be? According to the latest Bank of America fund manager survey, professional traders are shorting the dollar in near-record amounts. As Mike […]
Bullion vs Numismatic Coins: Which Should You Choose?
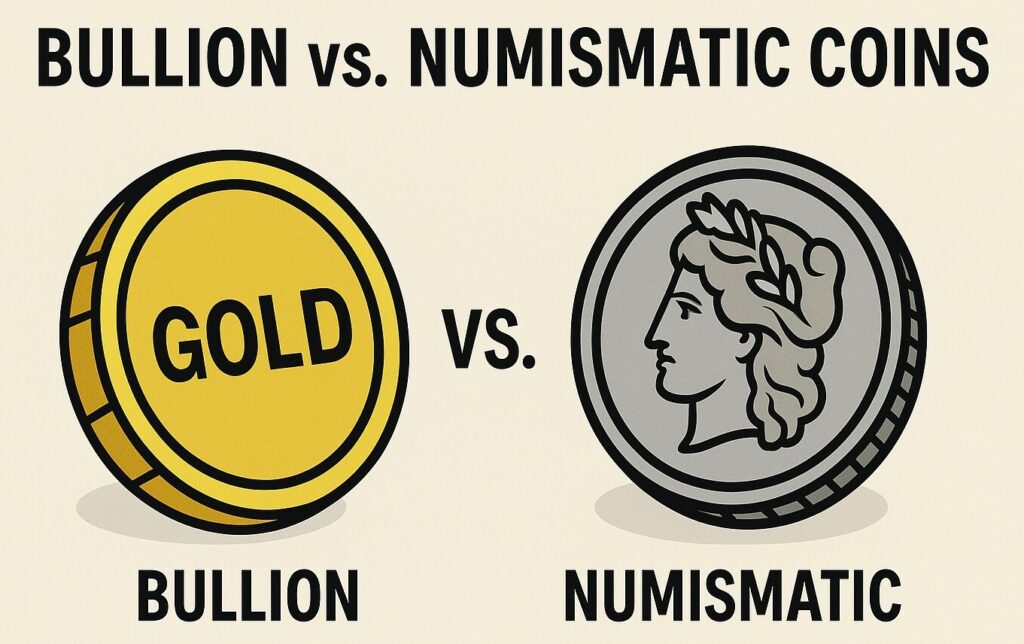
Bullion vs numismatic coins: Learn the key differences in choosing the best option for investing in precious metals with confidence.
The Gold Strategy That Nearly Doubles Traditional Portfolios

For decades, financial advisors have preached the same gospel: allocate 60% of your portfolio to stocks and 40% to bonds. It’s been the cornerstone of “responsible” investing, the safe harbor endorsed by nearly every major financial institution. Now, in a striking reversal, Goldman Sachs — one of Wall Street’s most influential voices — has released research that challenges this longstanding doctrine. Their findings? Adding gold to your portfolio doesn’t just improve returns slightly. It nearly doubles them. The Data that Debunks 60/40 In the latest episode of the GoldSilver Show, Mike Maloney and Alan Hibbard dissect Goldman’s groundbreaking research […]
As National Debt Tops $37 Trillion, There’s Still One Asset Washington Can’t Print

While the national debt soars $4.7 billion daily, this inflation hedge has zero counterparty risk…
How to Choose the Best Gold IRA Storage Option for You
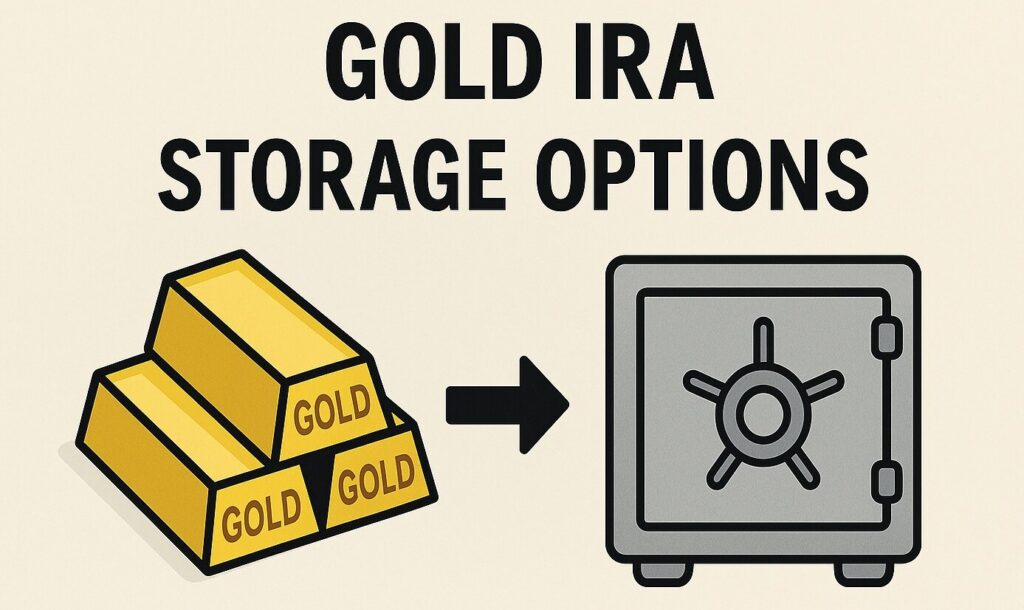
When investing in a Gold IRA, where you store your precious metals matters just as much as what you invest in. Your storage decision impacts not just your security — it determines your IRS compliance, your tax benefits, and your peace of mind. In this guide, we’ll break down the differences between storing gold at home and using a professional depository. You’ll learn what the IRS requires, the risks and rewards of each option, and which strategy makes the most sense for different kinds of investors. If you’re holding metals inside a self-directed IRA, the choice is clear: IRS-approved vault […]


