Gold Price Forecast 2026–2027: Key Predictions from Top Analysts
Gold is 13% below its January all-time high — and every major bank is calling it a buying opportunity. This analysis covers 2026–2027 forecasts from J.P. Morgan, Goldman Sachs, Wells Fargo, UBS, and more, plus the five structural forces driving the rally.
5 Signals That Say Gold’s Bull Case Just Got Stronger
Five forces converged this week — a Fed independence fight, an IMF stagflation warning, an Iran ceasefire on a countdown clock, an unusual gold-copper signal, and a silver market drawing down inventory for the fifth straight year. Each one tells a different story. All five point in the same direction.
The Largest Gold ETF Outflow Ever – But China Disagrees

North American investors pulled a record $13 billion from gold ETFs in March 2026. Chinese investors put a record $8.5 billion in — the same quarter. The World Gold Council data shows two markets treating gold in completely different ways.
Silver Market Deficit 2026: Six Years and Getting Worse
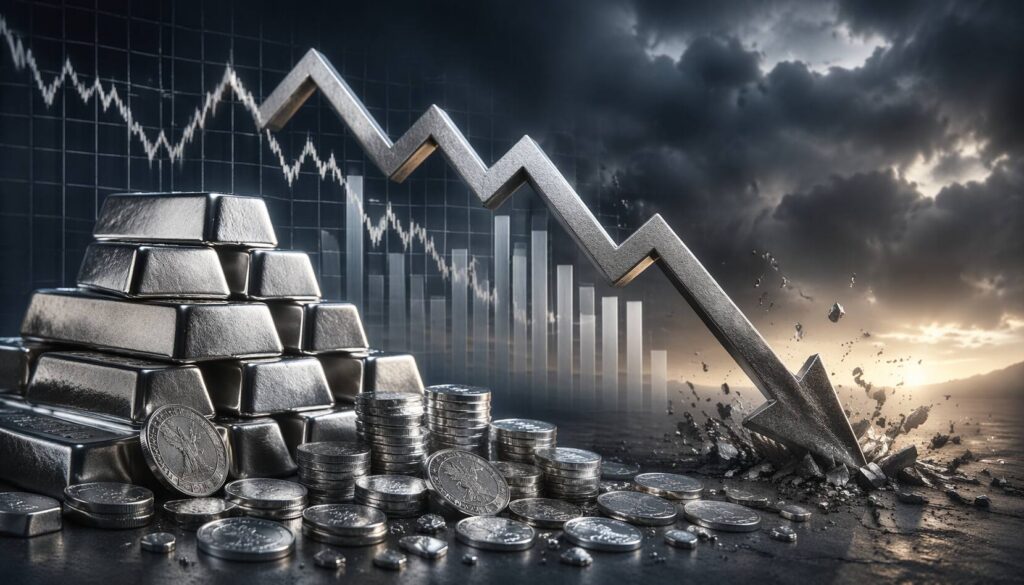
Silver has dropped 35% from its January record. But the Silver Institute just confirmed the supply deficit is getting worse, not better — with 762 million ounces drawn from global reserves since 2021. Here’s what that means.
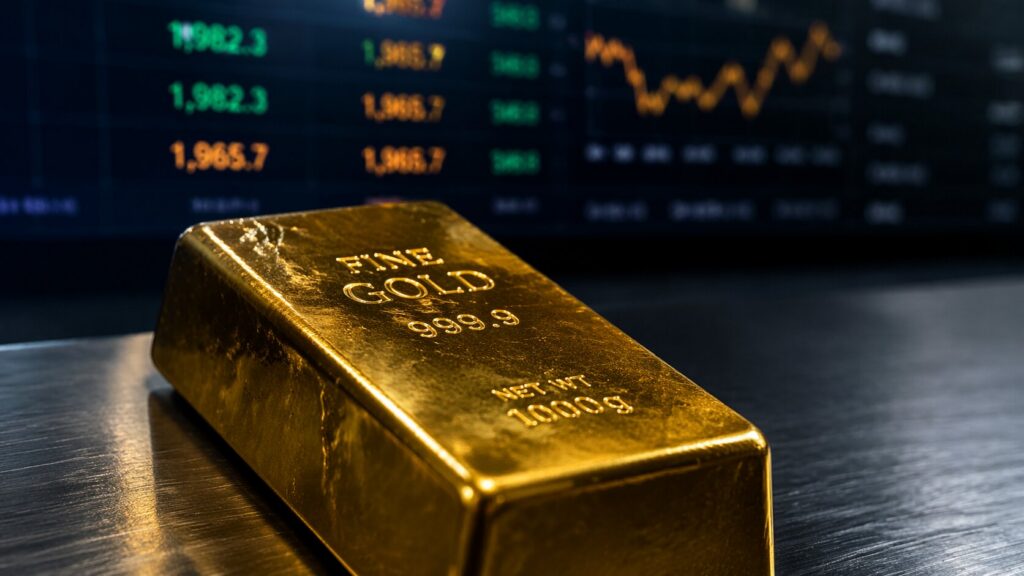
Is Now a Good Time to Buy Gold? Here’s the Macro Case
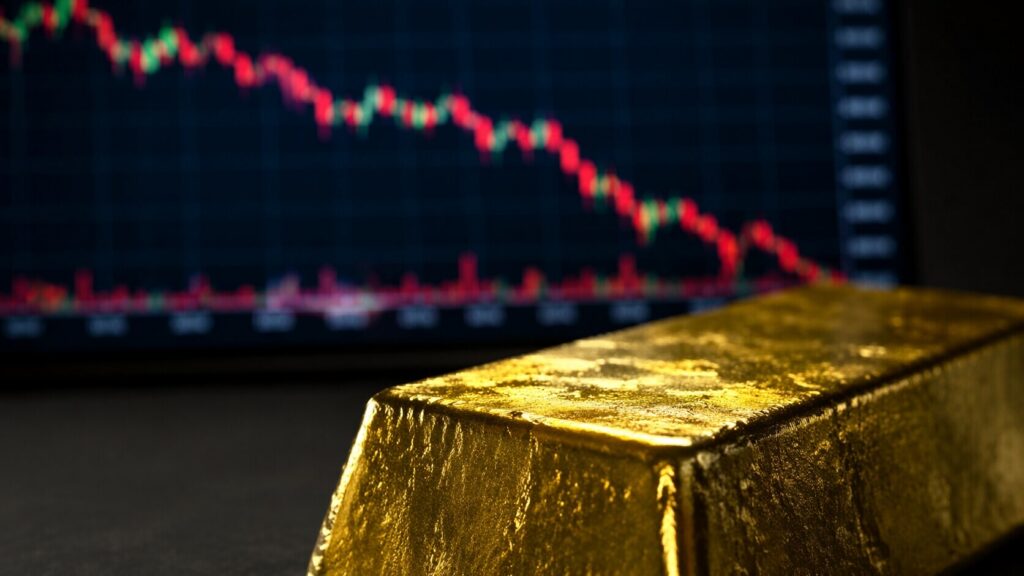
Gold has pulled back 13–14% from its January all-time high of $5,589. The dollar is weakening, the IMF has cut its growth forecast, and central banks bought 863 tonnes of gold in 2025. Here’s what the macro picture is signaling.
Is the Petrodollar Ending? What the Iran War Means for Gold

Deutsche Bank calls the Iran war a “perfect storm for the petrodollar.” Not everyone agrees — but the dollar’s reserve share has already fallen from 71% to 57% since 1999. Here’s what five key market developments mean for gold and silver investors today.
Is Gold a Better Investment Than Bitcoin Right Now?
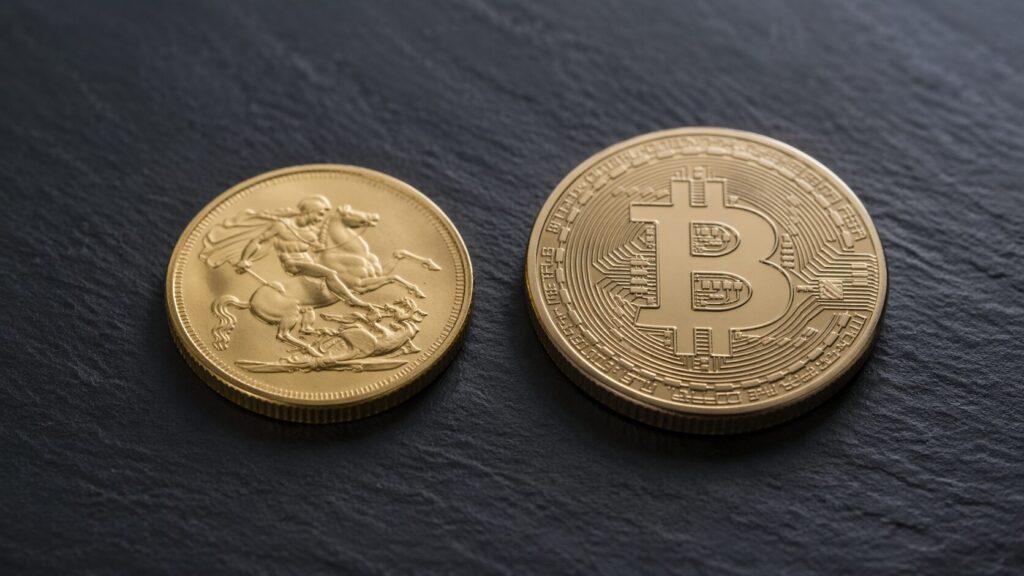
Gold hit an all-time high of $5,589 in January 2026 and has since pulled back 14%. Bitcoin is down more than 41% from its own 2025 record. The gap between those two numbers is the whole story.
France’s Gold Repatriation Is Done. Germany Is Next
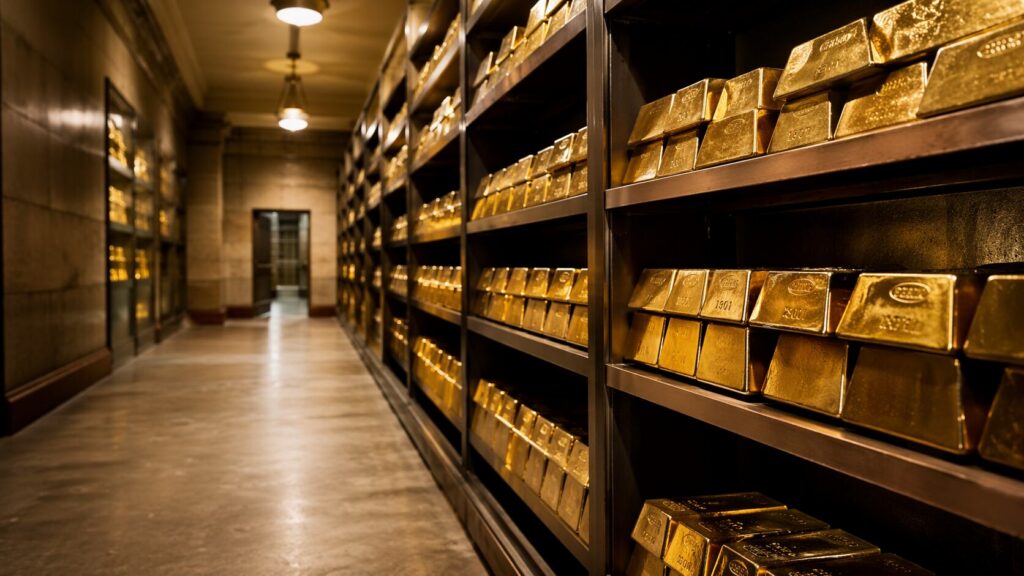
France sold 129 tonnes of gold held at the US Federal Reserve and replaced them with higher-quality bars in Paris — booking $15 billion in gains. It’s the latest move in a quiet global trend: central banks pulling sovereign gold out of American vaults.
Silver broke a historic record. The bigger signal isn’t the price.

Silver’s price is getting all the attention. But COMEX inventory drawdowns, a historic 10-month closing streak, and a Bank of America forecast ranging from $135 to $309 suggest the bigger story is happening beneath the surface.
Gold/Silver Ratio Hits 61.1 — Silver’s Turn to Run

Silver is outpacing gold for the second straight day as the gold/silver ratio compresses to 61.1. With a six-year supply deficit, stagflation signals, and central bank buying accelerating, silver’s structural case is finally finding its moment.
