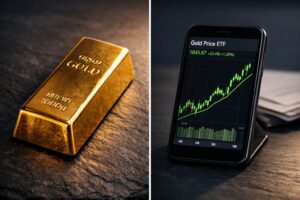
In April 2025, precious metals investors witnessed something remarkable: the gold-to-silver ratio briefly climbed above 100-to-1, meaning it took more than 100 ounces of silver to equal the value of a single ounce of gold. At GoldSilver, we published an analysis explaining why this represented a historic extreme — and a compelling buying opportunity for silver.
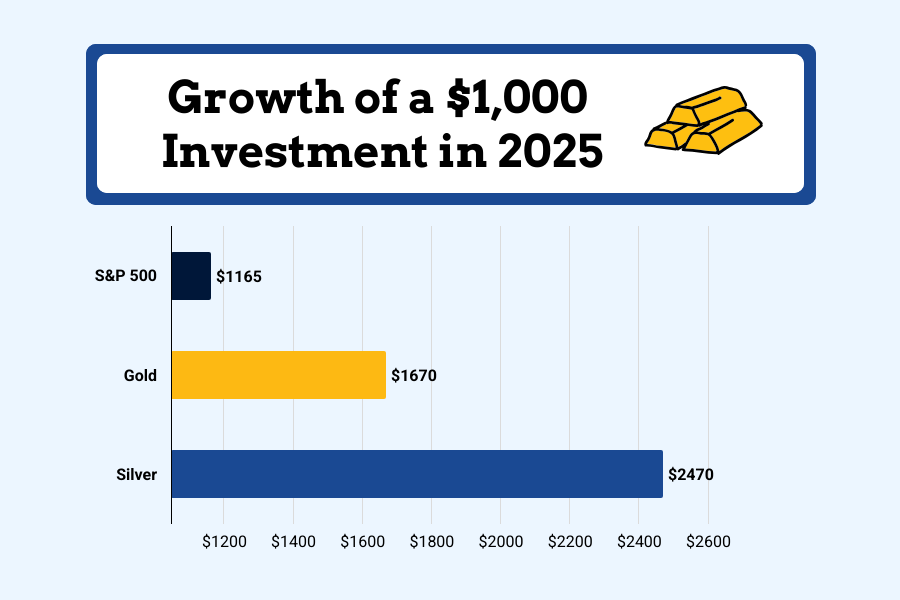
Nine months later, as we enter 2026, the ratio has compressed to roughly 57-to-1. Gold gained an impressive 67% during 2025.
But silver? Silver surged 147% — more than doubling returns for investors who recognized the opportunity when the ratio reached extreme levels.
This wasn’t luck. It was pattern recognition based on centuries of market history.
The Gold-to-Silver Ratio: A Historical Perspective
For much of human civilization, the gold-to-silver ratio wasn’t left to market forces — it was fixed by governments and monetary authorities. Ancient civilizations established ratios ranging from 15:1 in Rome to 12:1 in Byzantine times. The ratio remained relatively stable throughout the Middle Ages, typically hovering between 10:1 and 15:1.
In the United States, the Coinage Act of 1792 legally fixed the ratio at 15:1, establishing silver’s value relative to gold for purposes of currency. This fixed relationship meant that the two metals maintained a predictable relationship — not because of supply and demand, but because governments decreed it.
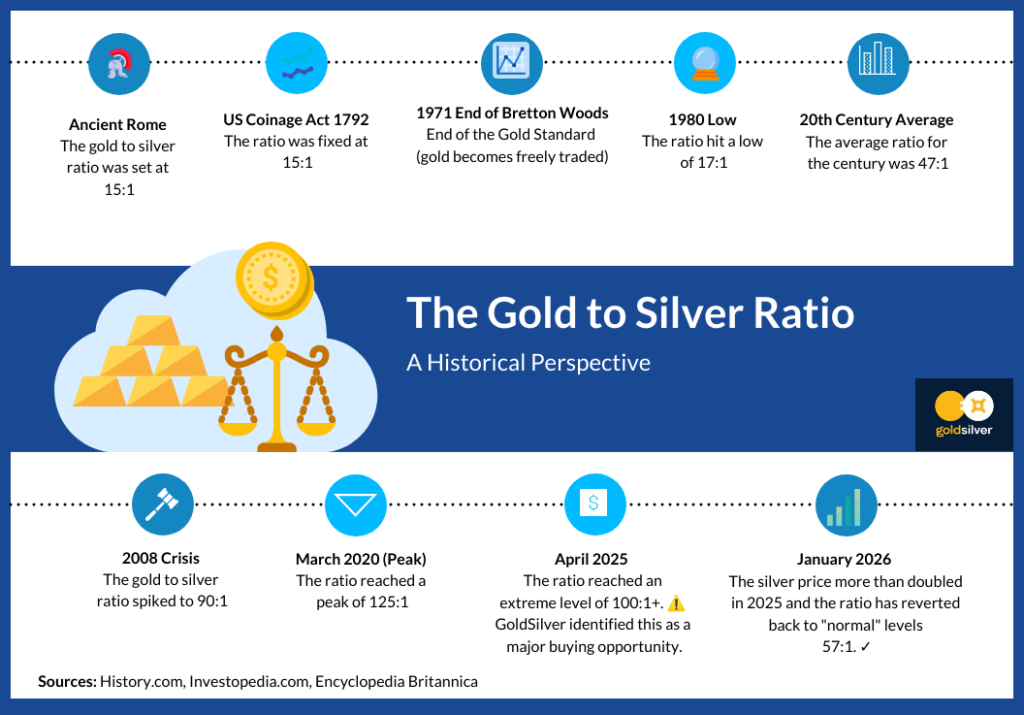
That all changed in the 20th century as nations abandoned fixed exchange rates and precious metals standards. When gold became freely traded on modern markets in the 1970s following the end of the Bretton Woods system, the ratio was suddenly determined by market forces alone.
Volatility Creates Opportunity
Once freed from government control, the gold-to-silver ratio became remarkably volatile. Instead of the historical 15:1 range, the modern ratio has swung dramatically — from a low of 17:1 in 1980 to a peak of 125:1 during the March 2020 market panic.
But here’s what decades of data have revealed: this volatility follows predictable patterns. When the ratio reaches extreme levels — whether unusually high or unusually low — it tends to revert back toward its historical mean.
During periods of financial stress, investors flee to gold as the ultimate safe haven, pushing the ratio higher. Gold commanded 90:1 during the 2008 financial crisis and 125:1 during the COVID market meltdown. But these extremes don’t last. As market conditions stabilize, silver — with its dual role as both industrial metal and monetary asset — typically catches up with explosive moves.
The pattern has repeated throughout modern market history. After peaking at 100:1 in 1991, the ratio fell to 40:1 by 1998 — a period during which silver dramatically outperformed gold. Following the 2008 spike to 90:1, silver surged to reach $50 per ounce by 2011, compressing the ratio back to 30:1.
For investors who understand this pattern, extreme ratios signal opportunity.

The Financial System Isn’t Safer — And You Know It As risks mount, see why gold and silver are projected to keep shining in 2026 and beyond.
April 2025: Identifying the Extreme
When the gold-to-silver ratio pushed above 100:1 in April 2025, GoldSilver recognized it as a significant extreme. Only a handful of times in modern market history had the ratio exceeded this level — during the 1991 recession, at moments during the early 1990s, and most notably during the March 2020 panic.
We published our analysis explaining why this ratio was unlikely to persist. Mike Maloney also alerted viewers on the GoldSilver YouTube channel suggesting mean reversion was probable:
- First, silver’s industrial demand fundamentals remained strong. The global push toward renewable energy continued driving silver consumption in solar panels, while electric vehicle production created additional demand for silver’s superior electrical conductivity.
- Second, silver mining supply faced persistent constraints. With most silver produced as a byproduct of other mining operations, supply couldn’t quickly respond to price signals the way many commodities can.
- Third, the ratio had reached a statistical extreme. At 100:1, the ratio sat more than two standard deviations above its long-term average — a level that had historically proven unsustainable.
The message was clear: this was likely a compelling opportunity to favor silver over gold in precious metals portfolios.
The Results: January 2026
As we begin 2026, the market has validated that analysis in spectacular fashion.
The gold-to-silver ratio now sits at approximately 57:1 — a compression of nearly 45 points from April’s extreme. That compression tells the story of silver’s explosive outperformance.
Gold’s 2025 performance was anything but ordinary. A 67% gain marked one of its strongest years in decades — fueled by relentless central bank buying, persistent inflation pressures, and rising geopolitical risk. Once again, gold did exactly what it’s supposed to do: preserve purchasing power when confidence in paper assets begins to erode.
Silver, however, told a very different — and far more explosive — story.
Silver’s 147% surge was extraordinary by any measure. Investors who accumulated silver when the gold-to-silver ratio exceeded 100:1 didn’t just outperform — they more than doubled the gains of portfolios holding gold alone. What looked uncomfortable at the time proved exceptionally profitable in hindsight.
This kind of outperformance doesn’t happen randomly. It’s the result of understanding relative value — and having the discipline to act when relationships between assets become historically stretched. The gold-to-silver ratio wasn’t merely signaling that silver was cheap. It was signaling that silver was mispriced relative to gold.
And while ratios don’t predict timing, they have a long history of identifying opportunity — often well before it becomes obvious to the broader market.
What This Teaches Us About Market Timing
The 2025 gold-to-silver ratio story offers several crucial lessons for precious metals investors:
Statistical extremes matter. When market relationships reach levels far outside historical norms, mean reversion becomes highly probable. The challenge isn’t identifying the extreme — it’s having the conviction to act on it when market sentiment says otherwise.
The ratio works as a valuation tool because it captures the relative pricing of two related assets. When one becomes substantially cheaper than the other compared to historical relationships, opportunity emerges.
It’s not about predicting absolute prices; it’s about recognizing when the relationship between assets has become unsustainable.
Patient capital wins. The ratio compression from 100:1 to 57:1 didn’t happen overnight. Those who bought silver in April had to watch the ratio remain elevated for several months before the mean reversion gathered momentum. Ratio investing requires patience and conviction.
Understanding these patterns doesn’t guarantee future results — markets can always surprise. But it provides a framework for identifying potential opportunities when market relationships become distorted.
Looking Forward to 2026
At roughly 57:1, today’s gold-to-silver ratio sits closer to its long-term average than it has in years. The extreme has corrected, and the dramatic outperformance opportunity that existed at 100:1 has largely played out.
But the lesson remains: the gold-to-silver ratio continues to be one of the most valuable tools in a precious metals investor’s toolkit. By understanding its historical patterns and watching for statistical extremes, investors can identify opportunities to optimize their precious metals allocation.
We’ll continue monitoring this ratio — and sharing our analysis when significant opportunities emerge. Because while we can’t predict exactly when the next extreme will arrive, history suggests it’s not a question of if, but when.
For the investors who acted on our April 2025 analysis, the results speak for themselves. For everyone else, it’s a reminder that in precious metals investing, understanding relative value can be just as important as predicting absolute price movements.
Investing in Physical Metals Made Easy

People Also Ask
What is the gold-to-silver ratio and why is it important?
The gold-to-silver ratio measures how many ounces of silver equal the value of one ounce of gold. This metric is important because it helps investors identify potential buying opportunities, determine relative value between the two metals, and make strategic allocation decisions. When the ratio reaches historical extremes, it often signals a potential reversal that investors can capitalize on.
Why is the gold-to-silver ratio falling right now?
The ratio is currently falling due to stronger silver performance driven by surging industrial demand, particularly from solar energy and electronics sectors. Additionally, economic recovery expectations favor industrial metals like silver over safe-haven assets like gold, while supply constraints in silver mining create upward price pressure.
What factors influence the gold-to-silver ratio?
Multiple factors influence this ratio including industrial demand for silver, investment demand for both metals, mining supply dynamics, economic conditions, monetary policy decisions, and currency strength. During economic uncertainty, gold often outperforms, pushing the ratio higher. During growth periods, silver’s industrial applications drive stronger performance, lowering the ratio.
What does a falling gold-to-silver ratio mean for silver and gold prices?
A falling ratio typically means silver is outperforming gold—either silver prices are rising faster than gold, or both are falling but gold is declining more. This often indicates growing industrial demand, economic optimism, or a correction from previously elevated ratio levels. For investors, it may signal an opportunity in silver or suggest rotating some gold holdings into silver.
How can investors use the gold-to-silver ratio to make informed decisions?
Investors can use the ratio as a timing tool by buying silver when the ratio is historically high (above 80:1) and potentially rotating into gold when it’s low (below 60:1). The ratio also helps determine optimal portfolio allocation between the two metals based on relative value. Additionally, monitoring ratio trends can provide insights into broader economic conditions and market sentiment.