Published: 06-04-2026, 03:17 pm
Tomorrow morning, the Bureau of Labor Statistics releases the May NFP jobs report at 8:30 a.m. ET — the number that will define the gold price into the Fed’s June meeting. That number will land directly on gold’s most important tension right now. Gold is trading near $4,481 today. Meanwhile, markets are pricing a meaningful chance of a Fed rate hike before year-end — the first time that’s been true since 2023. In a normal rate cycle, those two facts cannot coexist. The Fed raising rates crushes gold. Except this time, it hasn’t. That divergence is the setup for Friday.
The reason gold is holding — while hike risk is being repriced — is not a mystery. It’s a mechanism. Understanding it before the number drops gives you a framework that no headline can provide.
At 8:30 a.m. ET tomorrow, the Bureau of Labor Statistics releases the May jobs report. It is the final major data point before the Federal Reserve’s June 16–17 meeting. Gold is sitting directly in its crosshairs.
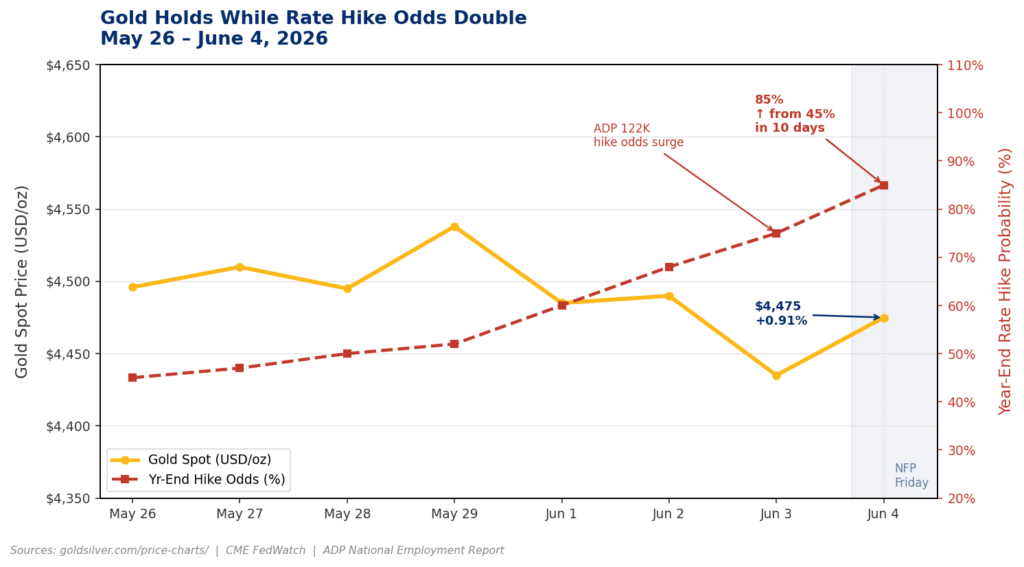
Gold is trading near $4,481 today, up roughly 1% as of Thursday afternoon (June 4, 2026). On the surface, that looks routine. It isn’t. The metal is holding at these levels even as futures markets have repriced meaningful rate hike risk into the forward curve — a level that, in any prior rate cycle, would have sent gold sharply lower. The fact that it hasn’t is the real story. Tomorrow’s jobs report is the next test.
What Does Wall Street Expect From the NFP Jobs Report?
The Wall Street consensus is for the US economy to have added approximately 80,000 jobs in May, with the unemployment rate holding at 4.3%. That number would sit below April’s 115,000 — consistent with a labor market that is slowing but not breaking.
ADP’s private payroll count for May, released Wednesday, came in at 122,000 — beating consensus and described by ADP’s chief economist as “more broad-based than we’ve seen in the last few years.” Meanwhile, JOLTS data this week showed April job openings rose to their highest level in nearly two years. As a result, the labor market heading into Friday’s print looks more resilient than expected. That resilience is what has pushed rate hike expectations higher in recent weeks.
Three Scenarios — and What Each One Means for Gold
Not all jobs prints are equal. Here is the decision map:
Scenario 1: Hot Print (above 120K jobs, wage growth above 0.3% m/m)
A strong headline with wage acceleration would cement the case for a Fed hike before year-end. Consequently, the dollar would likely spike, nominal yields would push higher, and gold would face near-term pressure. Expect a test of the $4,400–$4,425 support zone. The key question: does gold bounce quickly, as it has repeatedly this year, or does it break? If it holds, the structural floor thesis gets stronger.
Scenario 2: In-Line Print (75K–120K jobs, wages at 0.3%)
Markets have already priced considerable hike risk. Therefore, an in-line print confirms the “hold for longer” narrative without escalating it. Gold likely consolidates in the $4,450–$4,525 range. No resolution — the tension remains.
Scenario 3: Soft Miss (below 60K jobs, or wage growth at 0.2%)
A soft print changes the calculus entirely. Markets would begin pricing out hike probability. Real yields would likely compress — gold’s single strongest driver. As a result, a print under 60K jobs with soft wages could push gold back toward $4,600 as rate hike bets unwind.

The Edge Every Investor Needs Smarter precious metals investing starts here. The Nuggets Newsletter brings you essential market insights, Fed updates, global trends, educational videos, and much more.
Why Is the Fed Stuck Between Two Bad Options?
Here is what makes this jobs report different from prior ones. The Fed is not simply choosing between hiking and cutting. Instead, it is choosing between two policy mistakes at the same time.
Hiking raises the cost of servicing roughly $39 trillion in US government debt — a pile that now costs more than $1 trillion per year in interest payments alone. A 25-basis-point hike does not solve the inflation problem. It adds pressure to an already strained Treasury market. However, holding steady lets inflation run, eroding the purchasing power of every dollar-denominated savings account in America. PCE hit 3.8% with GDP at 1.6% — the stagflation signal is already confirmed.
Gold sits outside this system entirely. It cannot be debased. It carries no counterparty risk. Moreover, every time the Fed is forced to choose between two bad options, the case for holding some physical metal gets a little clearer. That is not doomsday thinking. That is the definition of financial sovereignty.
What to Watch Beyond the Headline Number
When the number drops Friday morning, look past the headline payroll count. Three numbers matter most. First, the unemployment rate — does it hold at 4.3% or tick higher? Second, average hourly earnings month-over-month — this is where the Fed actually lives. Third, labor force participation — if it falls while unemployment holds, the “strong labor market” story is partly statistical.
The June 16–17 FOMC meeting is 12 days away. Warsh chairs his first meeting as Federal Reserve Chair. Friday’s jobs report is the last major input before that decision. Gold’s stagflation track record gives context for what comes next.
Gold’s behavior after the print — not during it — will tell you the most about where the floor is.
Key Takeaways
- May NFP (consensus ~80K) drops Friday at 8:30 a.m. ET — the final major data point before Warsh’s first FOMC meeting June 16–17
- Gold is holding near $4,481 even as futures markets price meaningful rate hike risk — a structural divergence that has repeated itself all year
- A soft miss (below 60K) carries the sharpest potential gold reaction; a hot print tests the $4,425 support floor; in-line consolidates the current range
- The mechanism: a Fed choosing between two policy mistakes is the long-term thesis for sound money — regardless of Friday’s number
Stay On Top of Gold & Silver Prices
Get important market alerts sent straight to your inbox.
SOURCES
1. Bureau of Labor Statistics — The Employment Situation, April 2026; Job Openings and Labor Turnover Survey, April 2026
2. ADP Research — ADP National Employment Report, May 2026
3. CNBC — Private Payrolls Grew by 122,000 in May; Job Openings Hit Nearly Two-Year High in April 2026; Core Inflation Hit an Annual Rate of 3.3% in April; Kevin Warsh Wins Senate Confirmation as the Next Federal Reserve Chair
4. Kiplinger — What to Expect From the May Jobs Report
5. CME Group — 30-Day Federal Funds Futures and FedWatch Methodology
6. Polymarket — Fed Rate Hike in 2026: Market Odds
7. Money Morning — The Fed’s Inflation Gauge Just Hit a 3-Year High. A Rate Hike Is Back on the Table.
8. Benzinga — April PCE Rose to 3.8% YoY as Hormuz Energy Shock Fed Through
9. CNN Business — Kevin Warsh Sworn In as Fed Chair at Pivotal Moment for US Economy
10. Council on Foreign Relations — What to Expect From Kevin Warsh’s Fed in the First 100 Days
11. U.S. News & World Report — IMF Urges Fed Caution on Inflation as Warsh Prepares to Chair First Policy Meeting
12. Fox Business — US National Debt Tracker: $39 Trillion and Rising
13. Independent Institute — Another Trillion Racks Up for the National Debt
Disclaimer: This article is for informational purposes only and does not constitute financial or investment advice. Always consult a qualified financial adviser before making investment decisions.
You May Also Like:
- Gold Surges 1.5%: ADP, ISM, and Beige Book Trap the Fed
- Gold at $4,454 Says the Fed Is Trapped. Here’s Why.
- Central Banks Picked Gold Over Treasuries. Should You?
- Central Banks Just Crossed a Line Not Seen Since 1996
- Factory Costs Hit 82.1. That Number Is Now Working for Your Gold.
- Gold at $4,500: What Fort Knox, China, and Silver Are Telling You
- Silver Has Two Engines. Stagflation Is the One Condition That Fires Both at Once.
- The Buyer List for Gold Just Got Longer. These Countries Have Never Bought Before.
- PCE Hit 3.8%. GDP: 1.6%. Gold Went Up. Here’s the Mechanism.
- Gold Targets Are Falling. The $8,000 Forecast Isn’t.
- Gold Radar: 5 Stories the Price Chart Isn’t Telling You