Silver Rises Over 120% YTD




Published: 10-01-2026, 12:09 pm
Gold is trading a quiet, frustrating range this morning. It’s pinned near $4,166 an ounce on the live gold price chart. It’s still locked out of the $4,200 handle it was rejected from on Wednesday. Silver is holding steadier near $60.67 on the silver price chart. Neither metal moved much when the headline economic release of the morning landed. That’s exactly the problem. The number that did move is the one most traders skipped past.
What Did Today’s ISM Report Actually Show?
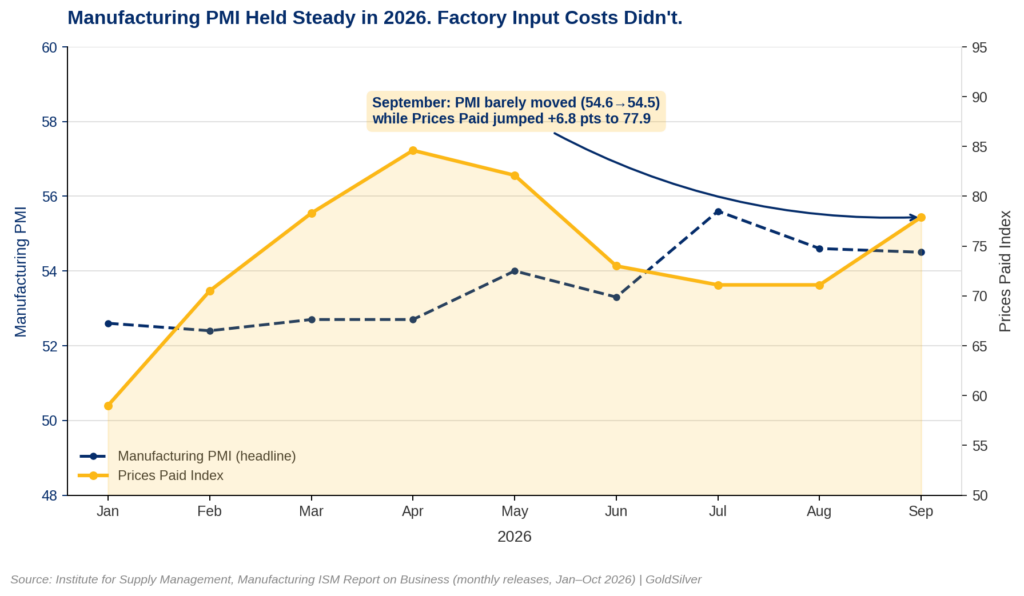
The Institute for Supply Management’s Manufacturing PMI dipped to 54.5 in September. That’s down marginally from August’s 54.6, and short of the 55.0 economists had forecast. On its face, that’s a shrug: manufacturing is still expanding, just a touch slower than hoped. New orders actually improved, rising to 55.3 from 53.7, and supplier deliveries eased slightly. Nothing here reads as alarming.

The Edge Every Investor Needs Smarter precious metals investing starts here. The Nuggets Newsletter brings you essential market insights, Fed updates, global trends, educational videos, and much more.
Why Does the Prices Paid Number Matter More Than the Headline?
Buried inside the same release is the figure that should have moved markets. The survey’s Prices Paid index jumped to 77.9, up from 71.1 in August. That’s the gauge of what manufacturers pay for raw materials and inputs. A jump of that size, in one month, is a factory-gate inflation signal, not noise. It also isn’t an isolated data point. Earlier this month, S&P Global’s flash Composite PMI reported input costs rising at their fastest pace in four years. Two independent surveys, three weeks apart, are now telling the same story. Pipeline inflation is building, even while headline growth looks unremarkable.
How Is Gold Reacting Right Now?
So far, barely. Gold’s muted reaction makes sense once you separate the two numbers the ISM report actually contained. A soft headline PMI, on its own, would normally support gold. Slower growth often argues for easier policy down the road. But the inflation reading inside the same report cuts the other way. For now, the two are roughly canceling out. Meanwhile, the 10-year Treasury yield is sitting near 5.34%, its highest level since 2002. The dollar index has pushed to a fresh year-to-date high near 101.85. That combination — elevated yields plus a firm dollar — is the real reason gold can’t clear $4,200. It’s not the PMI print itself. It’s the same real-yield headwind that’s been capping gold’s $4,000 floor all week.
What’s the Mechanism Connecting Factory Inflation to Gold’s Real-Yield Math?
This is where the Prices Paid jump earns its relevance. It matters to a gold investor, not just a bond trader. Gold holds no yield of its own. Its appeal rises and falls with the real yield on competing assets — the nominal Treasury rate minus expected inflation. As a rule of thumb, a 25-basis-point move in real yields tends to move gold. The typical swing is roughly $40 to $60 an ounce. Today’s data pulls on both sides of that equation at once. Firmer input-cost inflation should, in theory, lower real yields and support gold. But it also hands the Federal Reserve a reason to hold nominal rates higher for longer. That pushes the other way.
The Fed is not sitting on the sidelines here, either. It raised its target range to 3.75%–4.00% back on September 16 — its first hike since 2023. The median projection among policymakers still points to one more move by year-end. A second inflation-acceleration signal is arriving three weeks after the first. That’s exactly the kind of data that keeps the hike projection alive. It’s the kind that feeds a hike, not a hold. Silver carries its own industrial-demand exposure to these same factory-cost pressures. It’s worth watching alongside gold here, not instead of it.
What Happens Next?
The next real test arrives Friday, when the September employment report lands. A strong payrolls number alongside today’s Prices Paid spike would reinforce the case. The Fed’s hike would stay on the table. That combination tends to keep yields elevated and gold capped. A softer jobs print would complicate that read and give gold more room to work. Either way, the lesson from today isn’t that the ISM report was uneventful. It’s that the headline number and the number that actually moves metal prices aren’t always the same line. They don’t always live in the same sentence, either. The gap between them is worth reading every month, not just this one.
Stay On Top of Gold & Silver Prices
Get important market alerts sent straight to your inbox.
SOURCES
1. Reuters via Investing.com — US manufacturing steady in September, input prices increase
2. FXStreet — Gold struggles as rising US Treasury yields outweigh dovish Fed repricing
3. Yahoo Finance — Gold price today, October 1, 2026
4. U.S. Bureau of Economic Analysis — Personal Income and Outlays, August 2026
5. Investing.com — Jobless claims, manufacturing PMI, and ISM data due Thursday
Disclaimer: This article is for informational purposes only and does not constitute investment advice. Past performance is not indicative of future results. Always consult a qualified financial advisor before making investment decisions.
You May Also Like:
- Morgan Stanley Just Named Gold’s Floor. Here’s the Number.
- Gold Steadies Near $4,180. A GDP Upgrade Just Undercut the Inflation Miss.
- BlackRock Called It a Supercycle Today. The Mines and Vaults Already Agree.
- Gold Jumps as Core PCE Cools More Than Expected, Overshadowing the ADP Jobs Beat
- Job Openings Missed Today. That’s Exactly Why Gold Caught a Bid.
- Gold Fell Again. Five Wall Street Desks Can’t Agree on Why.
- Gold Just Hit a Two-Month Low. Yields, Not Iran, Are Why.
- Gold’s 7-Week Low: What the Chart Says Happens Next
- Gold Sank 4% Today. Five Other Signals Point to a Steadier Market Underneath.