 Silver Rises Over 120% YTD




Gold Hit a Three-Month High. Silver Hit a Two-Month High. One Story Connects Them.

Gold reached its best level since May and silver hit a two-month high, even as US growth data came in hot. Washington spent the week trying to force long-term interest rates down. That attempt failed, and the cost landed on the dollar instead. Five developments explain why both metals climbed.
What Is Sound Money? Why the Dollar Lost 87% of Its Value Since 1971

Sound money is money whose supply cannot be expanded by decree, so it holds its purchasing power over time. The principle shaped the 19th-century gold standard. Since that constraint ended in 1971, the dollar has lost roughly 87% of its purchasing power.
M2 Money Supply: The Number That Makes Your Portfolio Meaningless
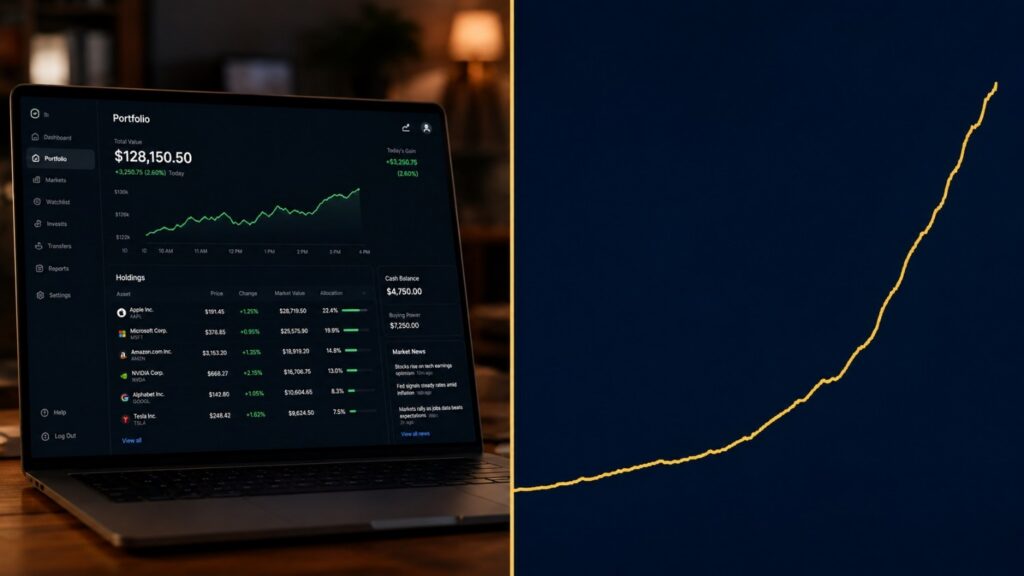
Most investors check their portfolio every day. Very few have ever looked at a chart of M2 money supply. That gap — between what feels important and what actually is — turns out to be one of the most expensive mistakes a long-term saver can make. Here is what M2 is, why it grew 55 percent since 2020, and why it tells you something your portfolio never will.
The Federal Reserve Has Eroded 97% of Your Dollar’s Value Since 1913. Here’s the Mechanism.
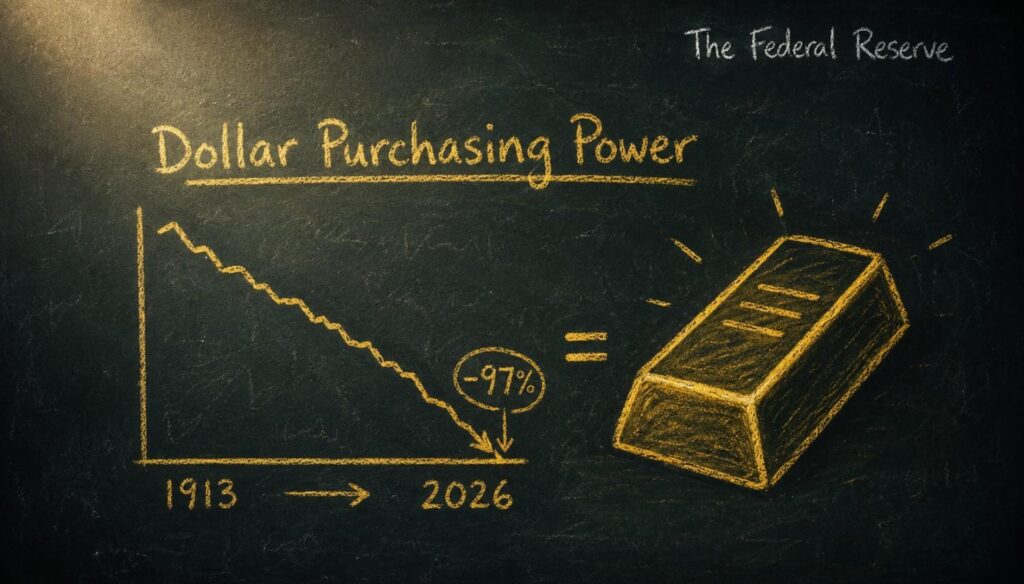
The Federal Reserve is the most powerful institution affecting what your money is worth — yet most people can’t fully explain how it works. This guide covers the Fed’s structure, dual mandate, and policy tools, and explains exactly why its 112-year track record of dollar debasement is the foundational case for owning gold.
What Is Purchasing Power — and Why Every Dollar You Save Is Slowly Being Taxed Away
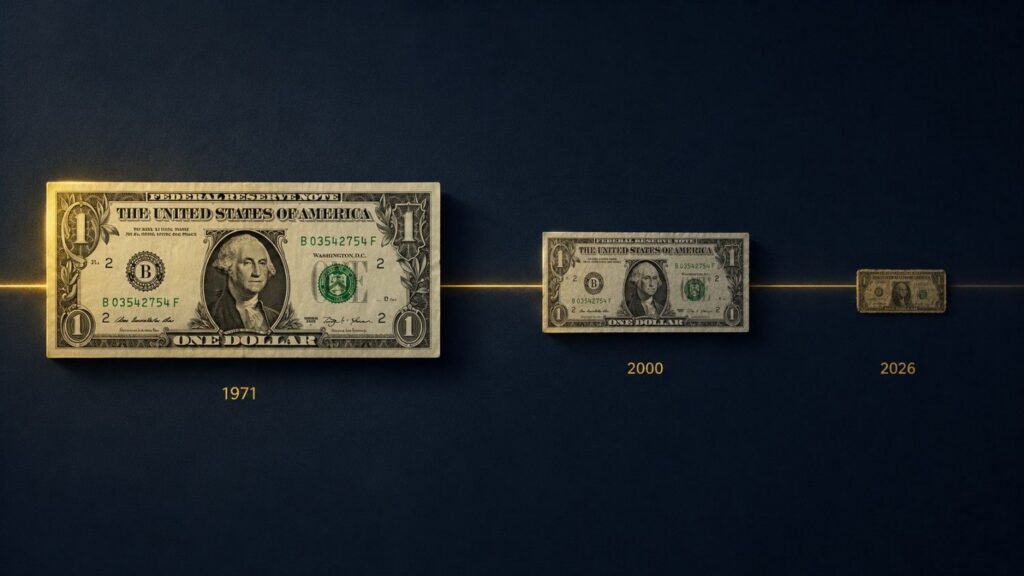
The dollar has lost 87% of its purchasing power since 1971. Learn what purchasing power actually is, why fiat currency erodes it, and why gold doesn’t.
Why the 10-5-3 Rule Fails Gold and Silver Investors
Excerpt:
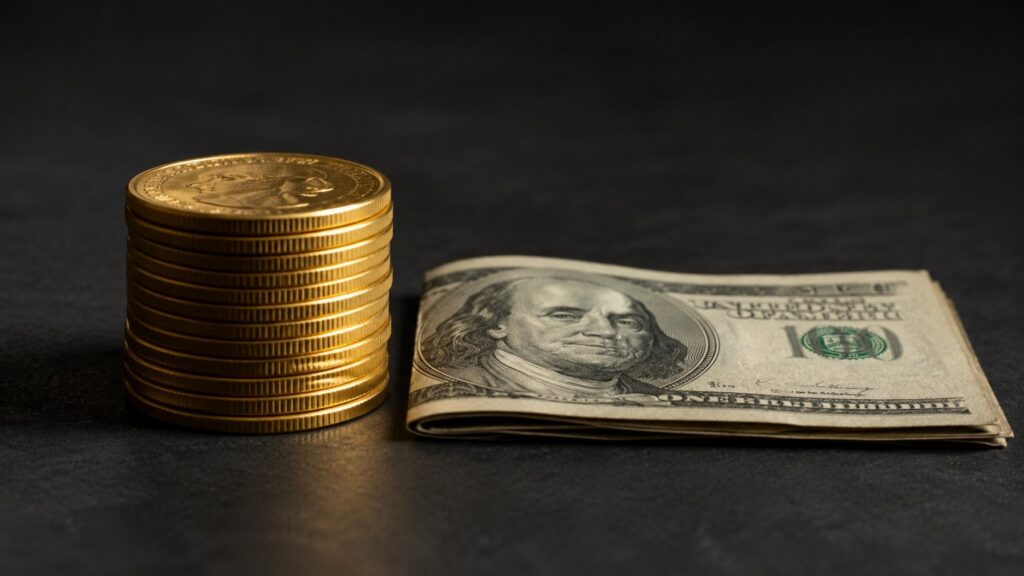
The 10-5-3 rule helps investors set return expectations for stocks, bonds, and cash. But gold and silver aren’t paper assets — and measuring them with a framework built for yield and earnings leads to the wrong conclusions every time. Here’s what precious metals investors use instead.
Who Wrote the Federal Reserve Act? Wall Street Did.

In 1913, Congress passed a law to control the banks. The men who drafted it were bankers. The dollar has lost more than 96% of its purchasing power since. That outcome wasn’t accidental — it was architectural.
When Gold’s Price “Goes Up,” You’re Reading It Backward
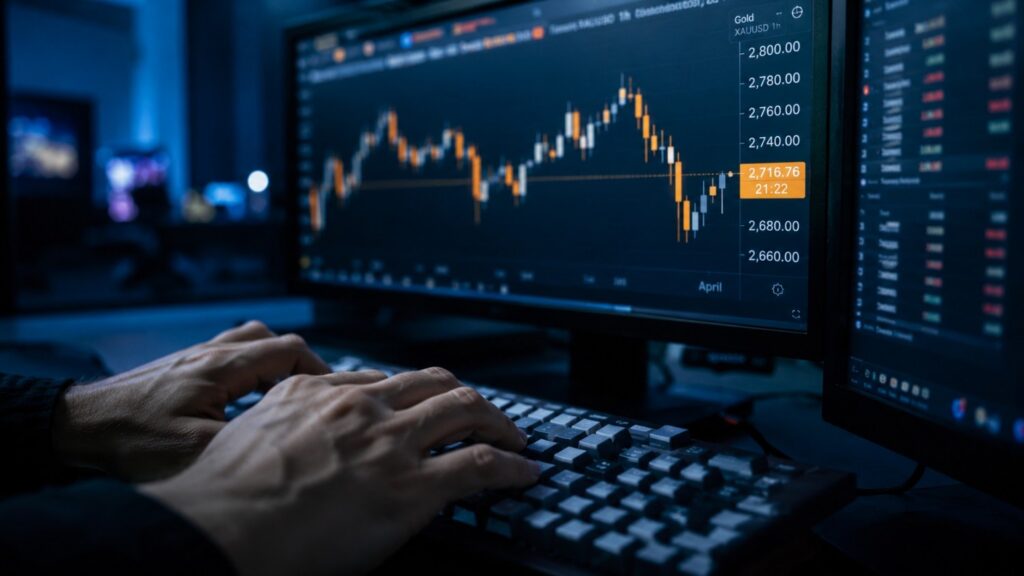
When gold’s price rises, most people think gold got more expensive. They’re reading it backward. Here’s why gold as a store of value changes how you think about money and savings.
Gold Confiscation: Could the Government Take Your Gold Again?
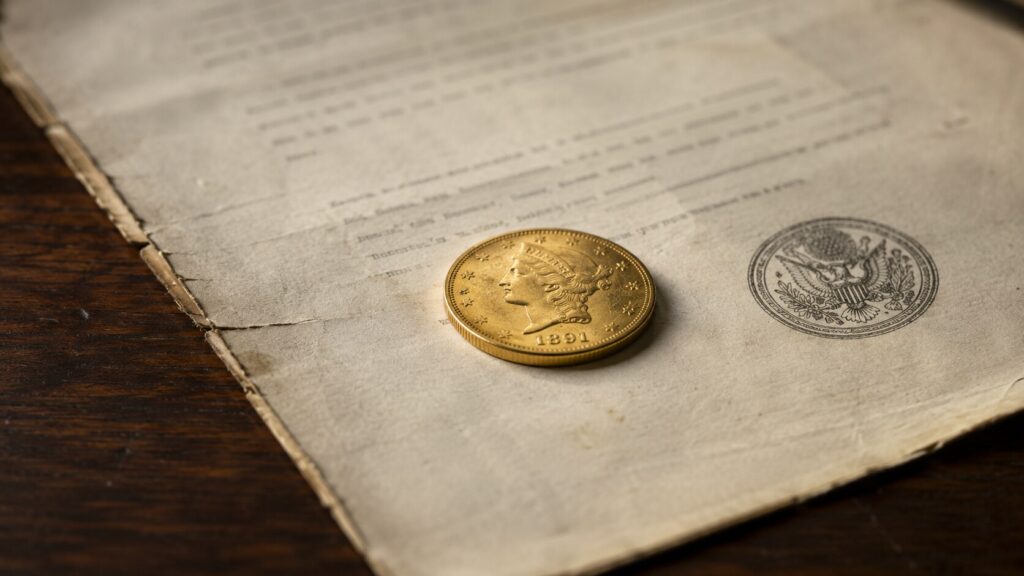
In 1933, the US government ordered Americans to surrender their gold at $20.67 an ounce — then revalued it to $35 and kept the difference. It was legal. It worked. But five major crises have passed since private ownership was restored in 1975, and confiscation has not happened once. Here is what actually changed, why the legal bar is now substantially higher, and what modern allocated ownership means for the question every gold investor eventually asks.
Gold Price History: From $35 to $4,500 in 100 Years
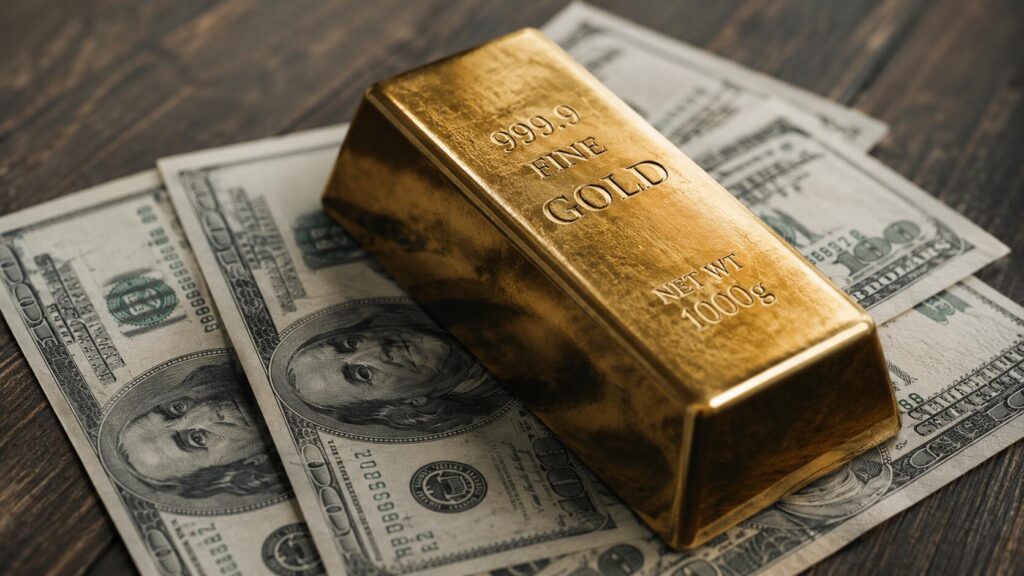
Gold went from $35 in 1971 to around $4,500 today — a 12,000% gain since the gold standard ended. Meanwhile, the dollar lost 96.9% of its purchasing power over the same period. These are not two separate stories. This is the complete gold price history: decade by decade, the real cause behind every major move, and what a century of data tells investors right now.


