 Silver Rises Over 120% YTD




What Backs the US Dollar? Not Gold. Not Silver.
Since Nixon closed the gold window in 1971, the dollar has lost 87% of its purchasing power. Here’s the structural mechanism behind that — and why it’s not reversible.
Gold Won’t Break. The Fed Just Told You Why.
The Fed just released its most hawkish minutes in over a decade. December rate hike odds hit 40%. The dollar surged. Gold barely moved. That non-reaction is not confusion — it’s the market pricing a structural ceiling on how far this Fed can actually tighten. Here’s the mechanism behind it.
Kevin Warsh Wants to Fix the Fed. The Math Says He Can’t.
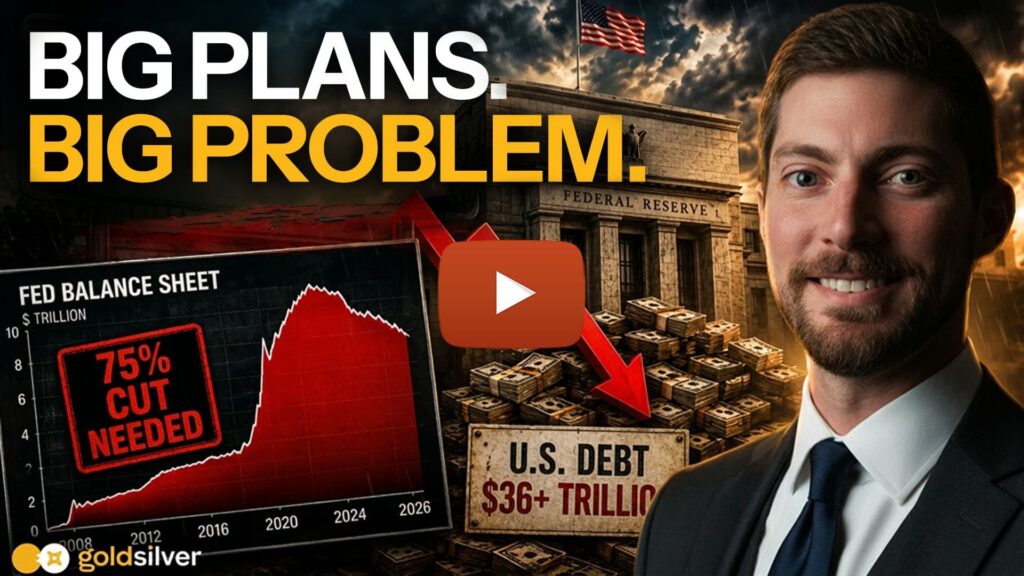
Kevin Warsh arrived at the Fed with a bold agenda — shrink the balance sheet, normalize policy, restore credibility. But with $6.7 trillion in assets, global bond yields at multi-decade highs, and markets pricing in rate hikes instead of cuts, the math is working against him. Alan breaks down why the plan may be dead on arrival and what it means for gold.
Jobs Beat, Ceasefire, Deficit: What It Means for Gold
April payrolls smashed forecasts, the U.S.-Iran ceasefire held under pressure, and the OMB projected a $2.065 trillion deficit. Gold barely moved. Five briefs explain why the structural case for physical gold is stronger than any single headline.
Why Peace Is Bullish for Gold in 2026 (And War Isn’t)
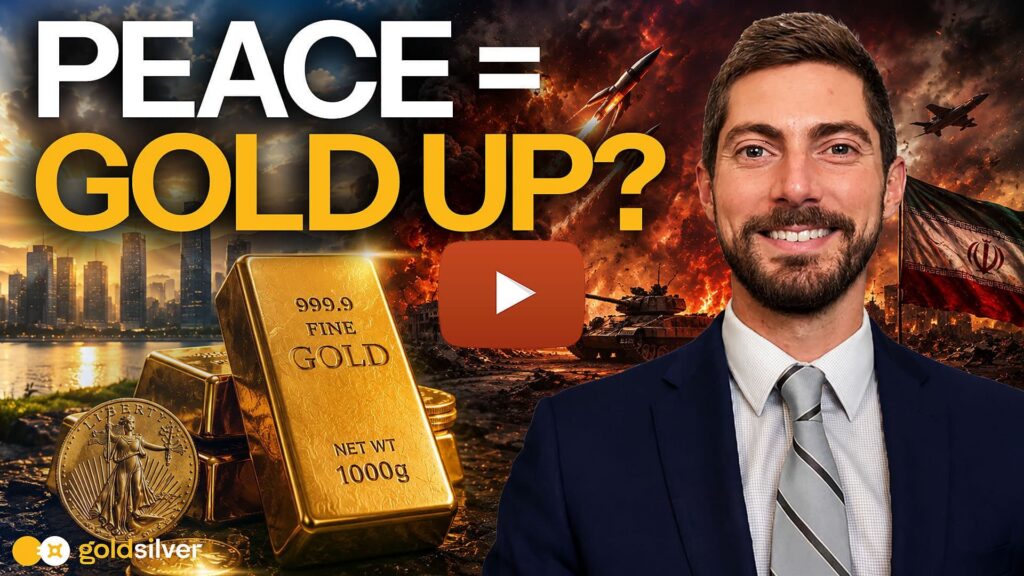
War usually pushes gold higher. But since Operation Epic Fury began in February 2026, the opposite has played out — gold sells off on escalation and rallies on peace. The reason ties back to fiscal dominance, oil prices, and the path to lower interest rates. This article breaks down the pattern, the macro logic behind it, and what it means for short-term and long-term gold investors.
Gold Price and Nonfarm Payrolls: Why the Fed Is Trapped
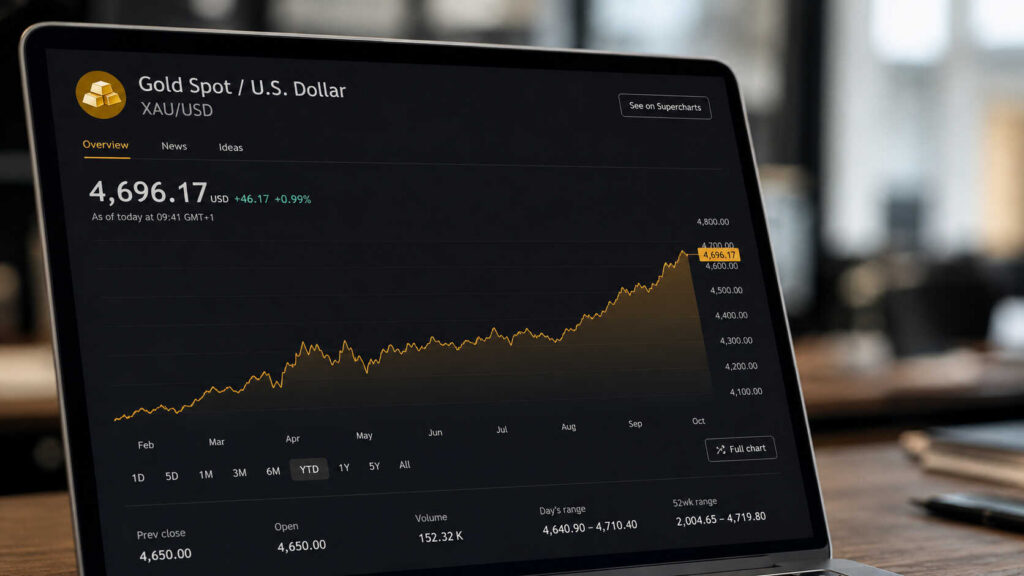
ADP printed 109,000 jobs in April — a beat by some measures, a miss by others. The gold price didn’t move. That non-reaction is the real story heading into Friday’s nonfarm payrolls report, and it comes down to one thing: the Fed is already frozen.
What the IMF’s Inflation Forecast Shift Means for Gold
The IMF spent weeks building its 2026 economic forecast. On May 4, its managing director declared it obsolete — and the reasons why create the clearest structural signal for gold investors this year.
Gold Is Up 41% From a Year Ago. The Fed Can’t Stop It
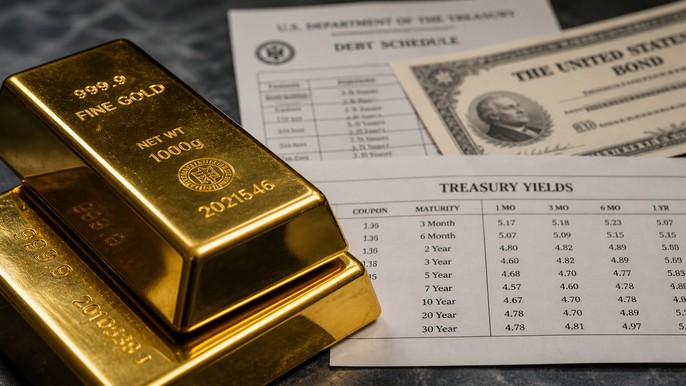
Gold is trading at $4,648/oz — up 41% from a year ago, down 14% from January’s record. Both numbers are true. The one that matters is the 41%. It held through a war, three hawkish Fed holds, and the most fractured FOMC vote since 1992. Here’s why that gap between the record and today’s price is a floor, not a warning.
Oil Hits $100 and OPEC Is Fracturing. Gold Knows Why.

Oil hit $100 for the first time since early April. The UAE just quit OPEC. The Fed is trapped. Each development points to the same place — and gold is already there.
Dollar Weakens, Gold Falls — and That’s Actually Bullish
The US just froze Iraq’s own oil dollars. Iran seized ships in the Strait of Hormuz. Gold fell anyway. The reason is a specific chain reaction most coverage misses — and once you understand it, the price action looks very different.


