Silver Rises Over 120% YTD


How Gold’s Correction Impacted Portfolios
A Fed chair who won’t forecast leaves owners watching the calendar. This post takes gold’s fall from its record close to its 2026 low, shows what it cost at three portfolio weights, and lists what the arithmetic cannot tell an owner.
Gold Hit a Two-Month High. Then It Pulled Back. The PPI Data That Caused Both Moves Is What Matters.
Gold hit a two-month high on Wednesday, then gave back ground Thursday as energy costs complicated an otherwise clean inflation signal. PPI came in flat. September Fed hike odds fell to 40%. ETF money is returning. Citi put a $90 target on silver. Here are the five developments shaping precious metals right now.
Gold’s 27% Drawdown Matches 2008 and COVID Almost Exactly. That’s Not a Warning.

Gold has fallen roughly 27% from its January 2026 high — almost identical to its drawdown in 2008 and during COVID. Both of those corrections resolved to significant new highs. Jeff Clark breaks down what history says comes next, why central bank buying hasn’t slowed, and the third historical parallel that makes this moment even more precise than either prior comparison.
Gold Fell 47 Percent in the 1970s Before Its Biggest Run. The Chart Looks Like Right Now.

In the middle of the 1970s gold bull market, gold fell 47 percent. Most investors sold. The ones who held watched it run nearly eight times from that low to the January 1980 peak. GoldSilver’s Megan King Diaz walks through the historical chart — and draws the parallel to where gold sits right now.
Why HSBC Still Believes Gold Hits $4,750 by Year-End (And What the Mainstream Is Missing)
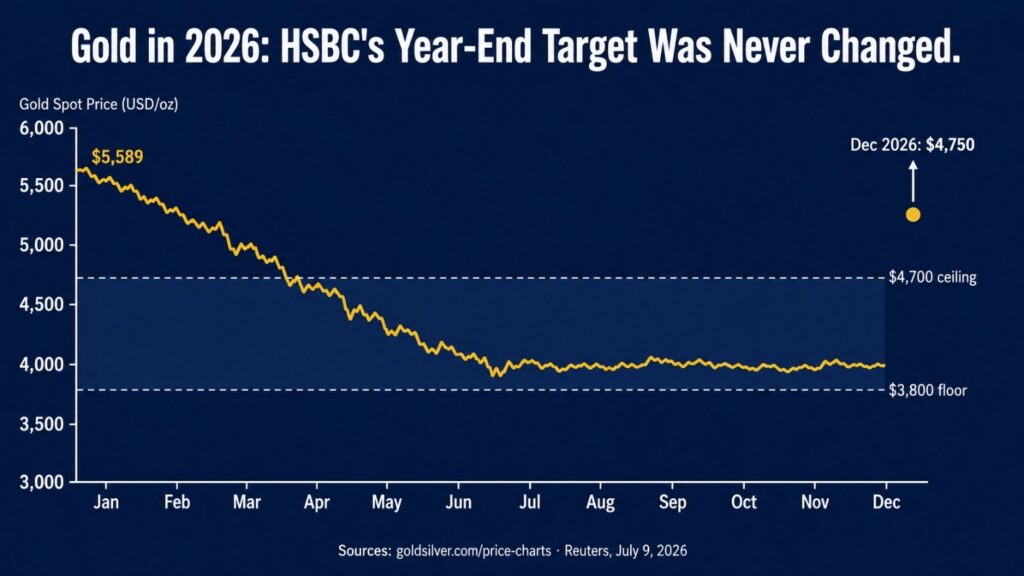
HSBC cut its 2026 average gold forecast by $304 on July 9. It left its year-end target at $4,750 unchanged. That gap between the two numbers is what the mainstream missed — and it tells you everything about where gold goes from here.
Gold Technical Analysis: A Complete Investor’s Guide
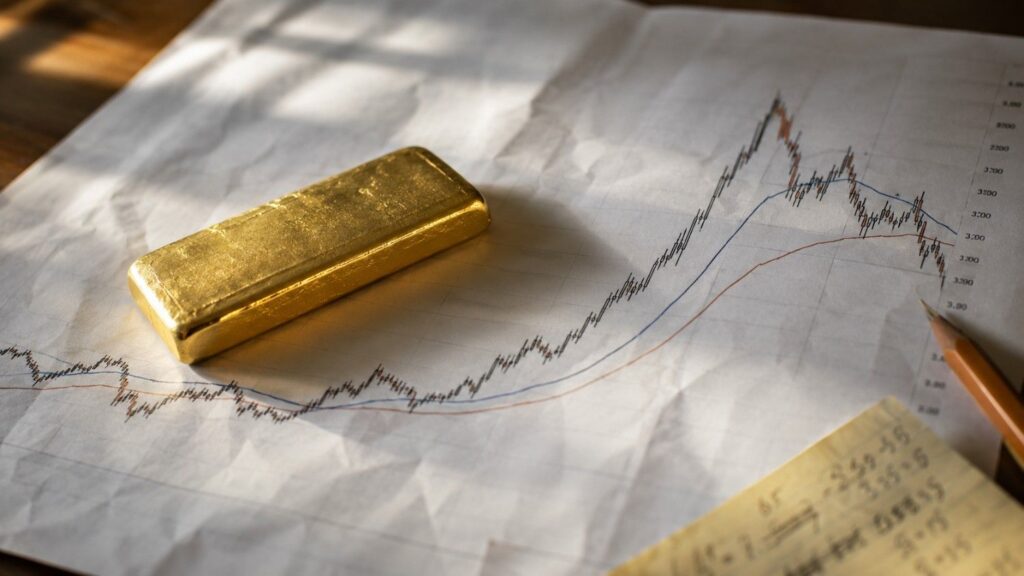
Gold technical analysis explains how moving averages, RSI, MACD, and Fibonacci retracement levels work — and how long-term physical holders can use them to size positions and time entries more intelligently.
Garner Calls a $3,600 Floor. Is Gold Going Lower?

Gold hit an all-time high of $5,589 on January 28, 2026. It is trading around $4,024 today. A new Fed Chair is explicitly trying to reverse the monetary policy trend that drove it there. Here is whether that changes anything for long-term holders.
Five Signals That Say Gold’s Correction Is a Reset, Not a Reversal
Gold is down 22% from its January high. But five signals published this week — a record central bank survey, a major bank holding its $4,900 target, and independent research confirming the structural drivers are undamaged — say the correction was positioning, not a thesis break.
Gold Is Down 22% — The Same Drop as 2022. The Floor Is Not the Same.
Gold has fallen 22% from its January 2026 all-time high of $5,589 — the same magnitude as the entire 2022 Fed hiking cycle. But in 2022, the Fed delivered 525 actual basis points of rate increases. Today, markets are pricing roughly a 43–50% probability of a single speculative hike that hasn’t happened yet. Same number. Very different floor. Here’s what the gap between those two corrections is telling long-term holders of physical gold.
What History Shows About Buying Gold After a Pullback
Gold has pulled back 16% from its January 2026 all-time high. History shows corrections inside an active bull market reward patient buyers — and the structural case for gold hasn’t changed.