Published: 06-08-2026, 09:25 am
Key Takeaways
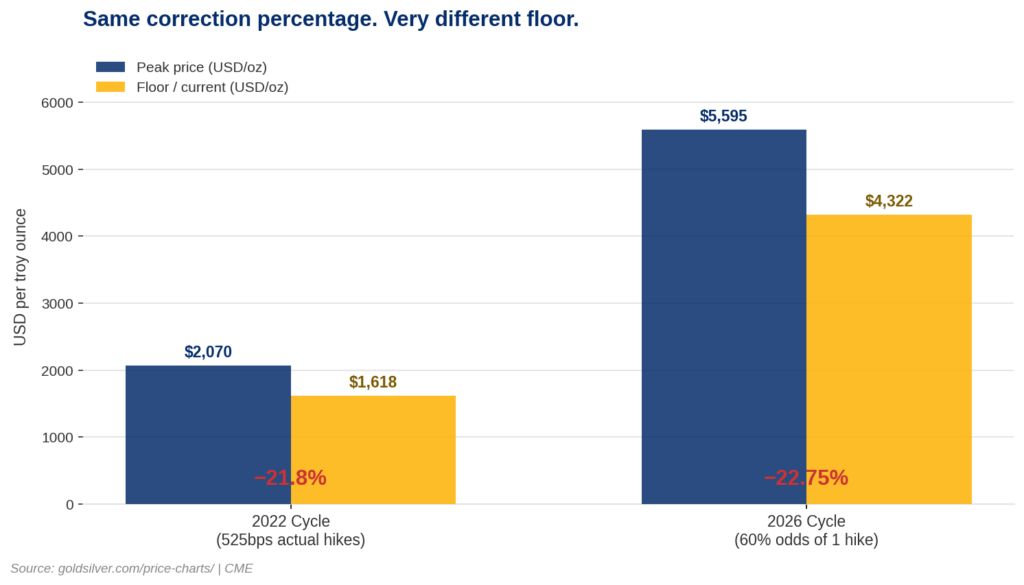
- Gold is down roughly 22% from its January 2026 all-time high of $5,589 — the same magnitude as the entire 2022 Fed hiking cycle, which delivered 525 actual basis points of rate increases.
- Central banks purchased 244 tonnes in Q1 2026 — the highest first quarter on record, per World Gold Council and Metals Focus estimates — a buyer category that does not respond to monthly jobs data.
- Two catalysts dominate the week ahead: May CPI on June 10 and the first FOMC meeting chaired by Kevin Warsh on June 16–17. Neither changes the structural sovereign demand floor.
The last time gold fell this fast, the Federal Reserve had hiked rates 525 basis points over 16 months.
This time, markets are pricing roughly a 43–50% probability of a single 25-basis-point hike — and it hasn’t happened yet. Gold is down nearly the same percentage from its peak. The cause is entirely different. So is the floor. Here’s what that gap is telling you.
Why Is Gold “Supposed” to Be Lower Right Now?
The classic rule is straightforward: when interest rates go up, gold goes down. Non-yielding assets become less attractive when savings accounts and bonds pay real returns. The math is clear.
Right now, the Fed funds rate sits at 3.50–3.75% following the April 29 decision. According to the CME FedWatch Tool, markets are currently pricing roughly a 43–50% probability of at least one 25-basis-point hike by year-end — the highest such odds since earlier this year. The 10-year TIPS yield — the real yield benchmark most gold traders track, per US Treasury data — remains positive. Furthermore, the dollar has strengthened on the back of a blowout May jobs report. The Bureau of Labor Statistics reported 172,000 jobs added in May against an 85,000 forecast. Every one of those data points is a textbook headwind for gold.
In contrast, look at 2022. The Fed hiked 525 basis points over 16 months. As a result, gold fell from roughly $2,070 to $1,618 — about 22%. Today, gold is down approximately 22% from its all-time high of $5,589, set on January 28, 2026, per CBS News and market data. The decline came largely on fear of a single speculative hike that hasn’t even been decided.
Same percentage drop. Very different cause.

The Edge Every Investor Needs Smarter precious metals investing starts here. The Nuggets Newsletter brings you essential market insights, Fed updates, global trends, educational videos, and much more.
Why Hasn’t Gold Followed the Real Yields Playbook?
Here is the mechanism the traditional model is missing.
From roughly 2010 to 2021, Western ETF investors drove gold pricing — an analytical pattern widely documented by the World Gold Council and commodity strategists at major banks. When real yields rose, they sold. When real yields fell, they bought. The correlation was nearly mechanical.
That changed in 2022. Russia’s invasion of Ukraine, and the subsequent freezing of approximately $300 billion in Russian dollar reserves, sent a signal to every emerging-market central bank: dollar reserves held abroad carry geopolitical risk. Consequently, the diversification away from US Treasuries into gold that followed was not a trade. It was a policy shift.
That distinction is precisely what makes gold down 22% on the fear of one speculative hike — not 525 actual basis points.
What Is Actually Keeping Gold Above $4,300?
Sovereign demand is the answer — and it operates on a completely different clock than futures traders.
Three consecutive years saw central banks purchase more than 1,000 tonnes annually: 1,136 tonnes in 2022, 1,051 tonnes in 2023, and 1,045 tonnes in 2024, according to the World Gold Council. Even as 2025 saw that pace moderate to 863 tonnes — still 82% above the pre-2022 annual average of 473 tonnes — Q1 2026 snapped back sharply. According to World Gold Council and Metals Focus estimates, central banks purchased 244 tonnes in Q1 2026 alone, the highest first quarter on record.
Moreover, Poland is targeting 700 tonnes in its reserves. The National Bank of Poland added 102 tonnes in 2025 and currently holds 550 tonnes, per the World Gold Council. Governor Adam Glapiński has publicly stated the intention to increase reserves to 700 tonnes for national security reasons. Similarly, the Bank of Korea announced its first gold-related investment since 2013 in Q1 2026, moving to incorporate overseas gold ETFs into its reserve portfolio, per the World Gold Council’s March 2026 central bank statistics.
These buyers are not momentum traders. They are not watching the jobs report. They have mandates.
This is what economists call “price-insensitive” buying. Whether gold is down 22% or down 5%, Poland still needs to reach 700 tonnes. That demand does not disappear because the new Fed chair is a hawk. Concerns about rate-hike pressure are real — but they only affect one category of buyer.
Is Gold Down 22% for the Same Reason as 2022?
Yes — substantially.
In 2022, when the Fed hiked 525 actual basis points, gold found its floor at $1,618. Today, with only roughly 50% odds of one speculative hike, gold is testing support near $4,300–$4,340.
That’s not the same market. The structural support underneath the current price is built from different material: sovereign reserve demand that responds to geopolitical architecture, not to monthly payroll data.
According to JPMorgan, gold is currently trading between its 200-day moving average near $4,340 per ounce and its 50-day moving average around $4,730. Notably, gold tested and briefly traded below that 200-day level on June 5 following the jobs report, before recovering. That zone is an active battleground, not settled support. JPMorgan analysts described the near-term picture plainly, noting rate-hike concerns are limiting short-term sentiment — nevertheless, the bank still sees gold recovering toward $4,900–$5,100 in the second half of 2026.
What Do May CPI and the Warsh FOMC Meeting Mean for Gold?
Two events dominate the week ahead.
First, May CPI prints Wednesday, June 10. A hot reading — another figure above 3.8%, matching April’s three-year high — would likely push gold toward the $4,250–$4,270 range as rate-hike odds spike further. A softer reading, or any signal that the Hormuz oil shock is easing, could push gold back toward $4,500.
Second, Kevin Warsh chairs his first FOMC meeting on June 16–17. Warsh was sworn in as Federal Reserve Chair on May 22, 2026, following Senate confirmation. His first policy meeting will test his independence amid White House pressure to cut rates, even as inflation remains above target.
Neither outcome changes the structural floor argument. Central banks are not selling gold because May CPI printed 3.9%.
The investor who owns physical gold today owns the same percentage of a fixed global supply that sovereign institutions are competing to acquire more of. Meanwhile, institutional forecasts from Goldman Sachs ($5,400) and JPMorgan ($6,000–$6,300) reflect that same structural thesis.
That’s not a doomsday argument. That’s portfolio mechanics.
Stay On Top of Gold & Silver Prices
Get important market alerts sent straight to your inbox.
SOURCES
1. CME Group — FedWatch Tool
2. US Treasury — Daily Treasury Real Yield Curve Rates
3. Bureau of Labor Statistics — May 2026 Employment Situation Summary
4. CBS News — Highest Gold Price in History
5. World Gold Council — Central Banks Resume Net Buying in April
6. World Gold Council / Metals Focus — Gold Demand Trends Q1 2026
7. JPMorgan via Yahoo Finance — JPMorgan Cuts 2026 Gold Outlook
8. Goldman Sachs via CNBC — Gold Climbs to Fresh All-Time High, Crossing $5,100
9. GoldSilver — Live Gold Price Charts
10. Federal Reserve — Kevin Warsh Takes Oath as Chairman
11. Morningstar — May Jobs Report: Fed Rate Hike Not a Done Deal
12. CNBC — Odds of a Fed Hike This Year Jump on Prediction Markets
13. Polymarket — Fed Decision in June 2026
14. Reuters — Gold Falls as Strong Jobs Data Boosts Rate Hike Fears
15. FRED / St. Louis Fed — Gold Fixing Price, 10:30 A.M. (London)
Disclaimer: This article is for informational purposes only and does not constitute financial or investment advice. Always consult a qualified financial adviser before making investment decisions.
You May Also Like:
- Silver Falls 6% on Jobs Beat. The Six-Year Deficit Didn’t.
- Gold Rate Hike Fears Are Weighing on Prices. Here’s the Full Picture.
- Gold at $4,480: Physical Demand Hits a 50-Year Milestone
- Gold Holds $4,481 With Rate Hike Risk Rising. Here’s the NFP Decision Map.
- Gold Surges 1.5%: ADP, ISM, and Beige Book Trap the Fed
- Gold at $4,454 Says the Fed Is Trapped. Here’s Why.
- Central Banks Picked Gold Over Treasuries. Should You?
- Central Banks Just Crossed a Line Not Seen Since 1996
- Factory Costs Hit 82.1. That Number Is Now Working for Your Gold.
- Gold at $4,500: What Fort Knox, China, and Silver Are Telling You
- Silver Has Two Engines. Stagflation Is the One Condition That Fires Both at Once.