Kiyosaki Gold Prediction: Buy the Dip or Wait?
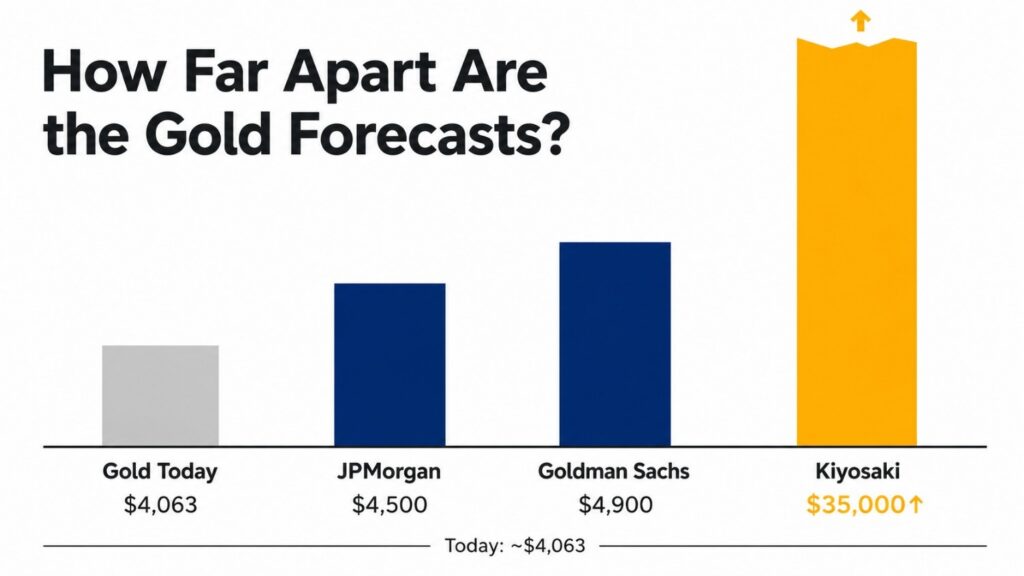
Robert Kiyosaki predicts $35,000 gold after a systemic collapse. Goldman Sachs targets $4,900. JPMorgan targets $4,500. Gold trades at $4,063 today — 27% below its all-time high. Here’s what the structural data says about buying the dip or waiting.
Gold & Silver Market Correction: Is the 2026 Bull Market Over?

Gold fell nearly 28% from its January 2026 all-time high. Silver dropped over 52%. Here is what caused the correction, why the structural bull case remains intact, and what central banks, the WGC, and institutional forecasters say about where gold and silver go from here.
Why HSBC Still Believes Gold Hits $4,750 by Year-End (And What the Mainstream Is Missing)
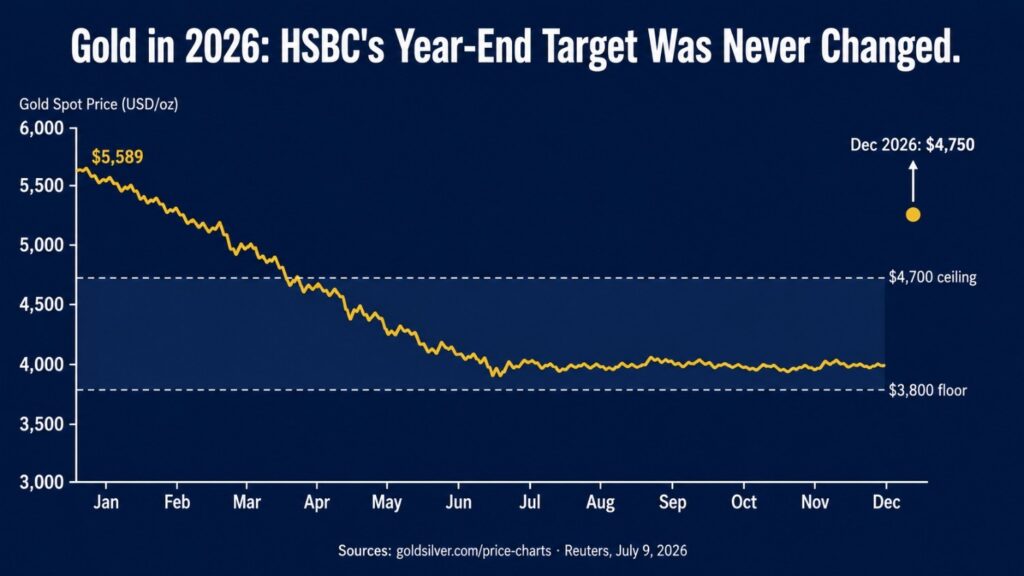
HSBC cut its 2026 average gold forecast by $304 on July 9. It left its year-end target at $4,750 unchanged. That gap between the two numbers is what the mainstream missed — and it tells you everything about where gold goes from here.
Gold Price Outlook July 2026: The Price Fell. Case Intact.
Gold trades 28% below its January record as Fed rate-hike expectations weigh on real yields. The structural case — central bank buying, fiscal expansion, reserve diversification — has not reversed. Here is what the macro picture means for gold holders in July 2026.
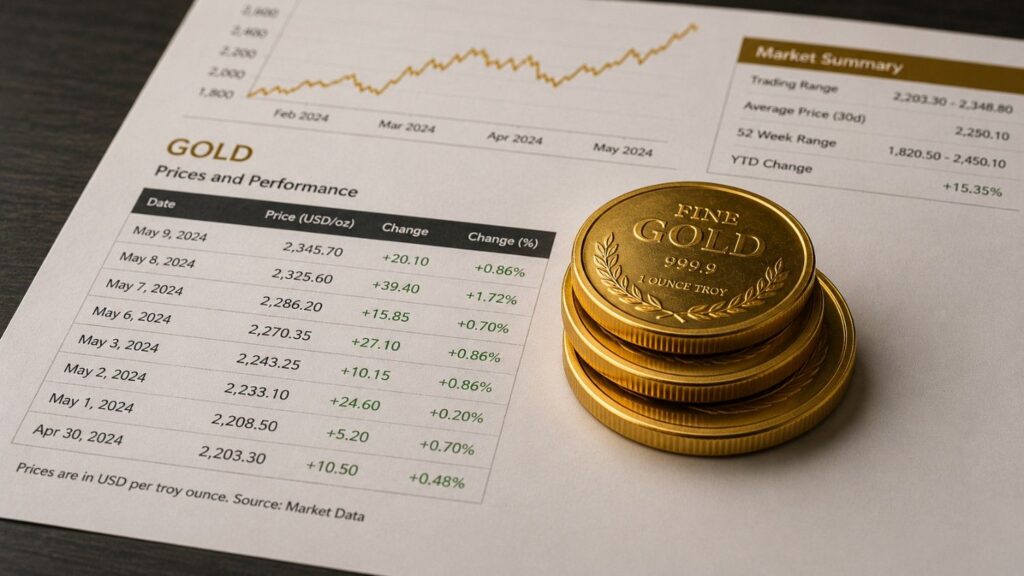
Gold Is Sitting on $4,000. The World Gold Council Has a Model for What Happens Next.
Gold is trading at $4,045 today — right on the threshold the World Gold Council identifies as fair value. Here is what happens if it holds, and what happens if it breaks.
Hawkish Fed, Gold Below $4,000, Silver Below $60 — and a Market That Disagrees.
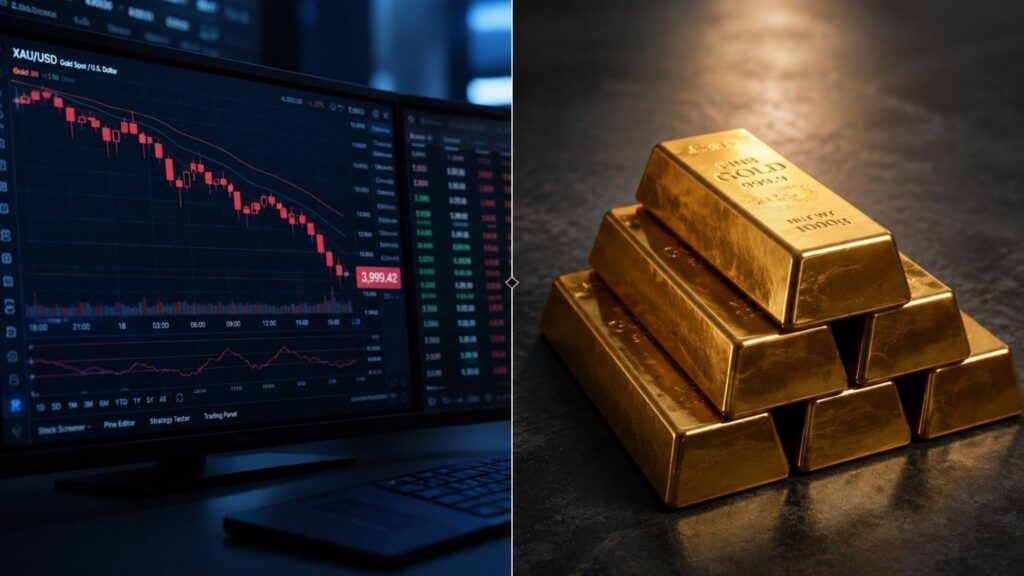
Gold broke below $4,000 for the first time since November 2025. China hit a two-year import high. Major banks held their targets. Five signals that tell the real story.
The Fed Went Silent. Gold Holders Don’t Need It to Speak.
Kevin Warsh scrapped forward guidance and skipped the dot plot at his first Fed meeting. Paper gold fell 2%, then recovered. Here’s why the biggest shift in Fed communication since 2008 leaves the structural case for physical gold exactly where it was.
Gold Price Outlook June 2026: What CPI and the Fed Mean

Gold is at ~$4,165 — 25% below its all-time high. May CPI confirmed at 4.2%. With Warsh’s first FOMC on June 16–17, here’s what the data means for precious metals investors.
Central Banks Just Crossed a Line Not Seen Since 1996

The ECB just confirmed gold has overtaken U.S. Treasuries as the world’s top reserve asset for the first time since 1996. India’s government denied selling $12 billion in gold the same morning Bloomberg said it did. And gold is trading $300 below what 30 Reuters analysts say it should be worth. Five signals. One story.
Gold Price Outlook May 2026: Why Institutional Forecasters Still See $5,000
Gold is trading near $4,694 — roughly 16% below its January 2026 all-time high — while inflation just hit 3.8%, central banks bought 244 tonnes in Q1, and J.P. Morgan is forecasting $5,000 by year-end. The fundamentals haven’t changed. The question is what you do with that.
