Published: 05-12-2026, 11:18 am | Updated: 06-12-2026, 08:56 am
This analysis covers the May 2026 gold market. For the latest outlook — including June CPI data, the Warsh Fed meeting, and current bank forecasts — read our Gold Price Outlook: June 2026 →
The gold price correction in 2026 has pulled gold down roughly 16% from its January all-time high of $5,589. Today, the Bureau of Labor Statistics reported that US inflation hit 3.8% in April — the highest since May 2023. Meanwhile, central banks net-purchased 244 tonnes in Q1, up 3% year-over-year. The structural drivers behind gold’s multi-year run have not reversed. Here’s what May’s pullback actually signals — and what to do about it.
Why Is the Gold Price Pulling Back in May 2026?
Gold hit $5,589 on January 28, 2026 — an all-time high. By May 12, it had fallen to around $4,694. That’s a 16% decline. Importantly, the reasons are specific, not structural.
Three things are working against gold right now. First, the US dollar has rebounded, and a stronger dollar mechanically pressures a metal priced in dollars. Second, the Strait of Hormuz has been effectively blocked since the US-Iran conflict escalated in late February, pushing oil above $100 a barrel. That energy shock, in turn, drove US inflation to 3.8% in April — the highest since May 2023, above the 3.7% forecast — which has killed any near-term rate cut expectations [Bureau of Labor Statistics]. As a result, traders have now priced out cuts entirely through year-end. Third, sentiment has shifted. When rate cuts disappear from the horizon, short-term positioning in gold tends to unwind quickly.
Taken together, this is a correction driven by a specific macro shock, not a breakdown in gold’s investment case. That distinction matters.

Your Gold Buying Guide Most investors overpay when they buy gold. Then overpay again when they sell. This guide shows you exactly what to own — and why.
Do the Fundamentals Still Support Gold?
A falling price and a failing thesis are not the same thing. Right now, the data is clear on which one this is.
Total gold demand in Q1 2026 reached 1,231 tonnes, worth a record $193 billion — up 74% in value year-on-year. Moreover, bar and coin demand rose 42% to 474 tonnes, the second-highest quarterly total ever recorded [World Gold Council, Q1 2026 Gold Demand Trends]. When the price dropped, physical buyers didn’t pull back. Instead, they stepped in. That’s not the behaviour of a market in distribution — it’s the behaviour of one with a durable floor.
The inflation backdrop reinforces this further. Energy costs are up 17.9% year-on-year. Additionally, real average hourly wages turned negative for the first time since April 2023. The April CPI print beat forecasts and sits nearly double the Fed’s 2% target. When real wages are falling and cash is being eroded, the argument for holding physical metal tends to write itself.
Are Central Banks Still Buying Gold?
Yes — and at levels that should settle the question of whether institutional demand has weakened.
Central banks purchased a net 244 tonnes in Q1 2026, up 3% year-over-year. Furthermore, that figure beat both the prior quarter and the five-year average. Poland’s central bank led the way, adding 31 tonnes to reach 582 tonnes — still building toward its 700-tonne target. Similarly, China’s People’s Bank added 7 tonnes, more than double its Q4 2025 pace [World Gold Council, Gold Demand Trends Q1 2026].
These aren’t reactive trades. Central banks move slowly and strategically. Their continued accumulation reflects a long-term shift away from US dollar reserves — a trend that’s been building for over a decade. Indeed, J.P. Morgan projects combined central bank and investor demand to average 585 tonnes per quarter in 2026. The bank also estimates that every 100 tonnes above 350 tonnes of net quarterly demand adds roughly 2% to the gold price quarter-on-quarter [J.P. Morgan Global Research]. At 244 tonnes from central banks alone, that floor is well-supported.
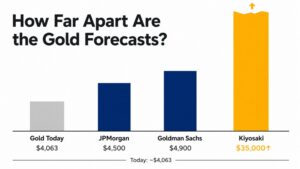
Where Do Institutional Forecasters See Gold by Year-End?
Higher than here. Considerably higher, in most cases.
Specifically, J.P. Morgan forecasts a Q4 2026 average of $5,055 per ounce — roughly 6.5% above current levels — with prices approaching $5,000 by year-end and pushing toward $5,400 by end of 2027 [J.P. Morgan Global Research]. In addition, TD Securities projects a 2026 annual average of $4,831, with peak levels near $5,400 in the first half of the year [TD Securities].
The London Bullion Market Association’s consensus forecast for 2026 sits at $4,741.97 [London Bullion Market Association]. Notably, gold is currently trading near or slightly below that midpoint — which means the market isn’t pricing in excessive optimism. A March BlackRock research note added another dimension: private wealth allocations to gold remain roughly 50% below where they were a decade ago. If that gap closes even partially, the incremental demand implications are significant.
Technically, the near-term picture is mixed. A cycle indicator for gold turned positive on May 9. However, short-term sell signals in major ETFs suggest some downside risk remains. Overall, the institutional forecasts, demand data, and inflation backdrop all point the same way — and it isn’t down.
Bank forecasts have been revised significantly since this analysis was published — see our June 2026 gold price outlook for current figures from Goldman Sachs, J.P. Morgan, and Morgan Stanley.
What Is the Gold-Silver Ratio Saying Right Now?
With gold at $4,694 and silver at $85.10, the gold-to-silver ratio currently sits around 55.16.
That puts it in a historically balanced range. A ratio in the 50–60 zone suggests neither metal is dramatically mispriced relative to the other. For context, compare that to the 2020 crisis, when the ratio spiked above 80 — gold was the clear choice then. Conversely, when the ratio compresses toward 40–50, silver tends to outperform. At 55.16, there’s no strong rotation signal in either direction. Both metals look reasonably valued in the context of the current bull market.
Is Now a Good Time to Buy Gold?
A 16% gold price correction in an established bull market has historically been a better entry point than the highs. That’s not a call to time the market — it’s a pattern that has held across multiple prior cycles.
The conditions that drive gold’s long-term value haven’t changed. Inflation is above the Fed’s target. Central banks are diversifying away from the dollar. Geopolitical risk is elevated. Furthermore, the dollar is structurally weaker. None of that shifted in May. What shifted, instead, was sentiment and short-term positioning — the kind of thing that creates entry points.
Dollar-cost averaging is the most practical tool in this environment. It means committing a fixed amount into physical gold on a regular schedule, regardless of price. As a result, it removes the pressure of picking the bottom, lowers your average cost through downturns, and builds a position over time without requiring perfect timing. Investors who used this approach over the five years to May 2026 saw gold move from approximately $1,870 to $4,694 — a gain of over 150% [Trading Economics]. No single entry in that window was ideal. The strategy did the work.
People Also Ask
Is the 2026 Gold Price Correction a Sign of a Bear Market?
No. A 16% pullback from an all-time high, with inflation at 3.8%, 244 tonnes of central bank buying in a single quarter, and bar-and-coin demand at its second-highest quarterly level ever, is not a bear market. Rather, it’s a correction inside an ongoing structural bull market. The underlying drivers remain intact.
Why Is Gold Falling While Inflation Is Rising?
Because in the short term, gold responds to the dollar, real interest rates, and sentiment — not just inflation. Specifically, the Iran conflict pushed oil prices up, which pushed inflation up, which killed rate cut expectations, which strengthened the dollar, which pressured gold. That chain of events is real but temporary. Historically, this kind of divergence resolves in gold’s favour once dollar strength fades.
What Is the Gold Price Forecast for the End of 2026?
J.P. Morgan forecasts a Q4 2026 average of $5,055, with prices near $5,000 by year-end. In addition, TD Securities projects a 2026 annual average of $4,831, with highs near $5,400. Most major institutional forecasters expect gold to trade above current levels by December 2026.
Should I Buy Gold or Silver in May 2026?
The gold-to-silver ratio at 55.16 puts both metals in a historically balanced range — neither is dramatically cheap or expensive relative to the other. Gold offers monetary stability, while silver offers more upside leverage and industrial demand exposure. A split allocation of roughly 3:1 or 4:1 in favour of gold by value is a common starting point.
How Does Dollar-Cost Averaging Work for Gold?
You commit a fixed amount — say, $500 per month — to physical gold regardless of where the price is. When prices fall, you buy more ounces. When prices rise, you buy fewer. Over time, therefore, your average cost per ounce drops below what a lump-sum buyer at the wrong moment would pay. It’s especially useful with gold, where short-term volatility can make timing feel impossible.
If You’ve Read This Far, You’re Already Thinking About It
Gold at $4,694 is not the same story as gold at $5,589. It’s a better entry point — provided the fundamental case holds. Today’s data says it does.
Consider the evidence. Inflation is at 3.8%. Central banks bought 244 tonnes in a single quarter. Physical demand hit its second-highest quarterly level on record. Moreover, every major institutional forecaster expects gold to trade higher before the year is out. The correction is real. So is everything beneath it.
Most people who find themselves reading articles like this during a dip spend a week or two weighing the data, agree it makes sense, and then don’t act. That’s the most common outcome. However, the window doesn’t stay open indefinitely.
If you’re ready to move, opening a GoldSilver account takes a few minutes. Live pricing on bars, coins, and vaulted storage — no pressure, just worth having it ready.
Stay On Top of Gold & Silver Prices
Get important market alerts sent straight to your inbox.
SOURCES
1. U.S. Bureau of Labor Statistics — Consumer Price Index, April 2026
2. World Gold Council — Record Gold Prices Continue to Shift Demand Dynamics (Q1 2026 Press Release)
3. World Gold Council — Central Banks, Gold Demand Trends Q1 2026
4. J.P. Morgan Global Research — Gold Price Forecast 2026 and Beyond
5. London Bullion Market Association — Precious Metal Prices & Analyst Forecasts
6. TD Securities — Commodities Research & Gold Price Outlook
7. Trading Economics — Gold Price
8. Discovery Alert — Gold Price Update: May 2026 Cycle Signals and Market Outlook
Disclaimer: This article is for informational and educational purposes only. It does not constitute investment advice. Please consult a qualified financial adviser before making any investment decisions.
You may also like:
- India’s ‘Patriotic’ Gold Buying Freeze: What It Means for Prices
- How to Time Your Gold & Silver Buys Using Technical Analysis
- Silver Jewelry or Bullion? A Buyer’s Guide to the Real Difference
- Gold and Oil Move Opposite Ways. Here’s Why That Matters
- 7 Timeless Warren Buffett Rules for Gold & Silver Investors
- Gold vs. Bitcoin: Which Hard Asset Will Protect Your Wealth?
- Why Central Banks Sell Gold — And What It Means for Prices
- Why Gold Deserves a Permanent Spot in Your Portfolio