 Silver Rises Over 120% YTD




Two Soft Inflation Prints. Gold Is Still Below $4,500. One Number Is Keeping It There.
Two consecutive soft inflation prints — July PPI flat, CPI up just 0.1% — should be pushing gold through $4,500. Here is the one number keeping the ceiling in place, and the threshold to watch for when it lifts.
China Bought the Most Gold Since 2023 in July. Here’s Why.
China’s central bank just recorded its largest single-month gold purchase since October 2023. The number is notable. The structural reason behind it — a 19-percentage-point reserve allocation gap that no short-term price move will close — is what every gold owner needs to understand.
Gold Climbs 1% Ahead of July CPI. Here Is Why the Print Matters More Than the Number.

Gold climbed above $4,427 on Wednesday as markets positioned ahead of the July CPI release and cut September Fed hike odds to 50-50. Here is the real-yield mechanism driving the move — and why the structural case is unchanged regardless of the print.
Trump Just Said the US Is Only ‘Semi-Negotiating’ With Iran. That One Word Changes Everything for Gold.

Trump told Axios the US is only “semi-negotiating” with Iran — comfortable letting Tehran’s collapsing economy do the work. Here is what that shift in strategy actually means for gold prices, and why the Hormuz stalemate is starting to look less like a temporary spike and more like a structural floor.
Gold Opened at Its Highest Level Since June. Five Things Are Keeping It From Going Higher.
Gold hit a seven-week high after July’s jobs shock cut September rate-hike odds to 44%. Five forces are now pulling on the outcome — and CPI Wednesday is the override switch.
Gold Had Its Best Week Since January. Wednesday’s CPI Could Take It Back.
Gold pulled back Monday after its best weekly gain since January. Here is the exact mechanism behind last week’s 7% move, why Wednesday’s CPI print is the deciding factor for the September Fed decision, and what Iran’s refusal to reopen the Strait of Hormuz means for the inflation picture.
Gold Just Climbed to a 7-Week High. One Number Changed Everything.
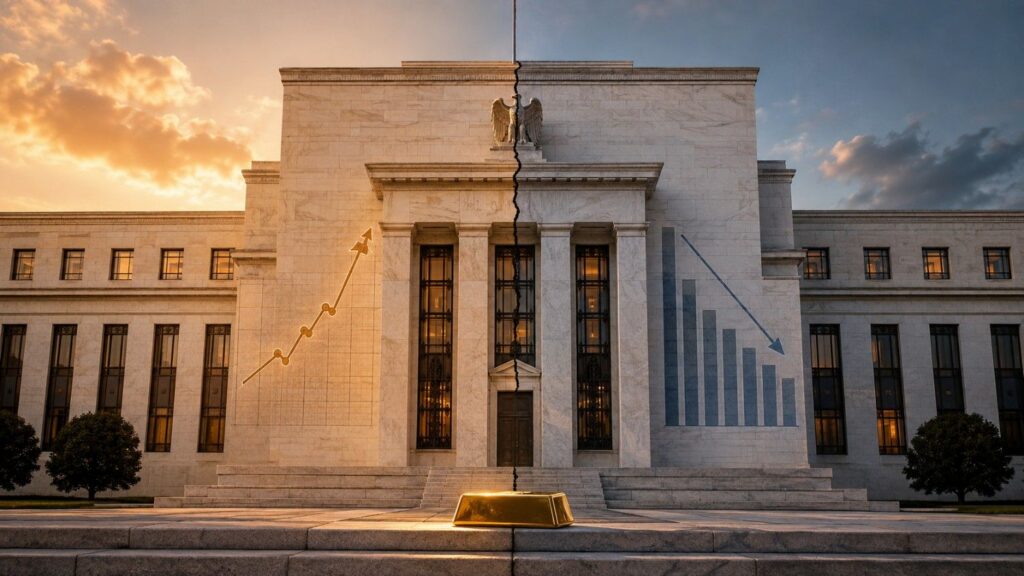
The Fed spent six months focused on one problem: inflation. July’s jobs report just gave it a second one — and gold climbed to a 7-week high as a direct result.
Jobs Missed. Gold Hit $4,200. Silver Hit $62.
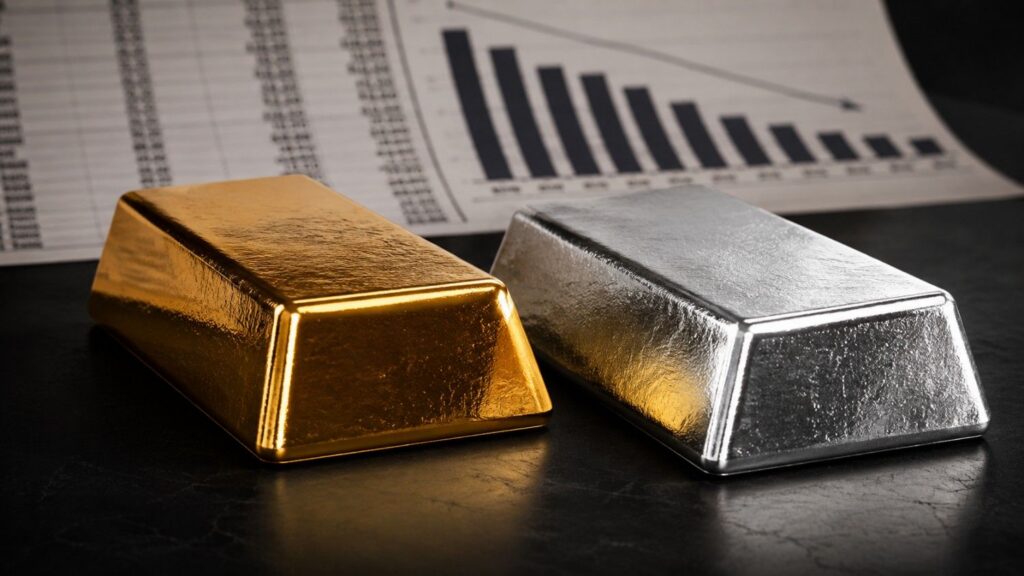
July ADP private payrolls came in at just 44,000, less than half the forecast. Here is the three-force mechanism that sent gold to $4,200 and silver to $62.
The Government Changed How It Measures Inflation Three Times. Here’s What It Did to the Number.
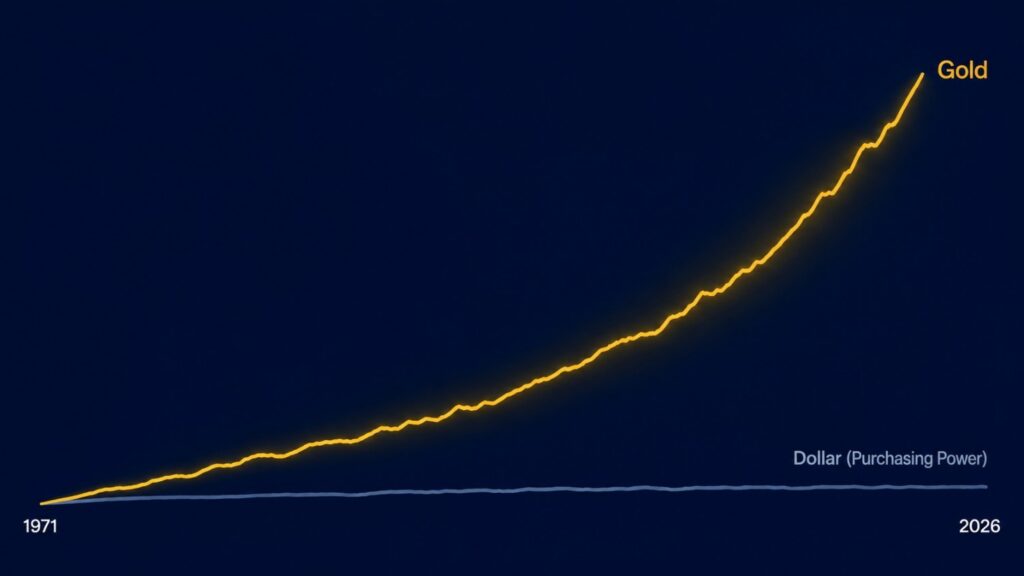
The CPI has been revised three times since 1983. Each change lowered the reported inflation rate. Here’s the mechanism behind every change — and what it means for your savings.
M2 Money Supply: The Number That Makes Your Portfolio Meaningless
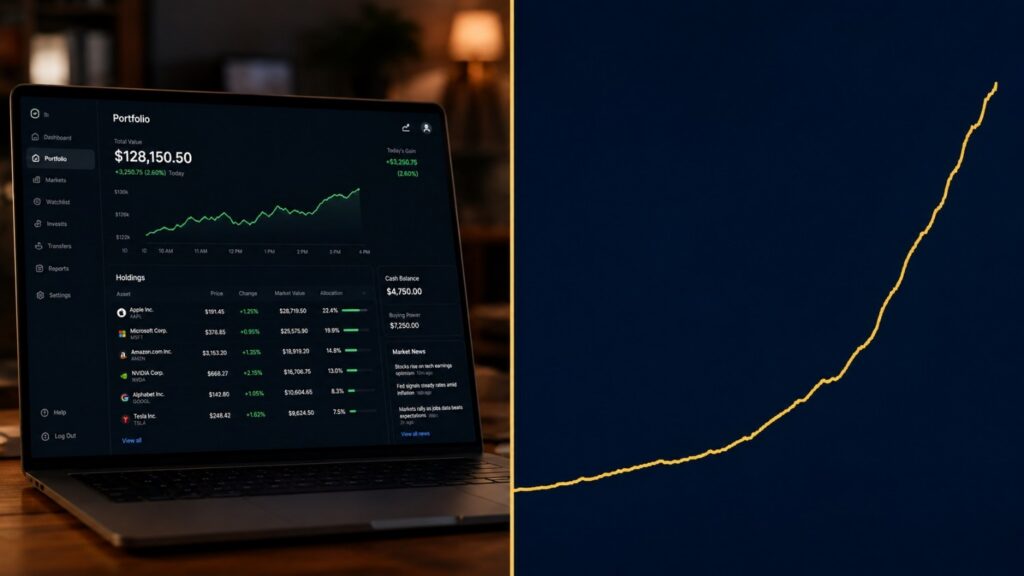
Most investors check their portfolio every day. Very few have ever looked at a chart of M2 money supply. That gap — between what feels important and what actually is — turns out to be one of the most expensive mistakes a long-term saver can make. Here is what M2 is, why it grew 55 percent since 2020, and why it tells you something your portfolio never will.


