Silver Rises Over 120% YTD


How Gold Price Is Set: The East-West Tide Explained

For 90 years, gold has moved in a recurring tide between Western financial markets and Eastern physical holders. Understanding who sets the price — and why that mechanism is shifting — is the most useful mental model a gold investor can carry.
Gold Price History: From $35 to $4,500 in 100 Years
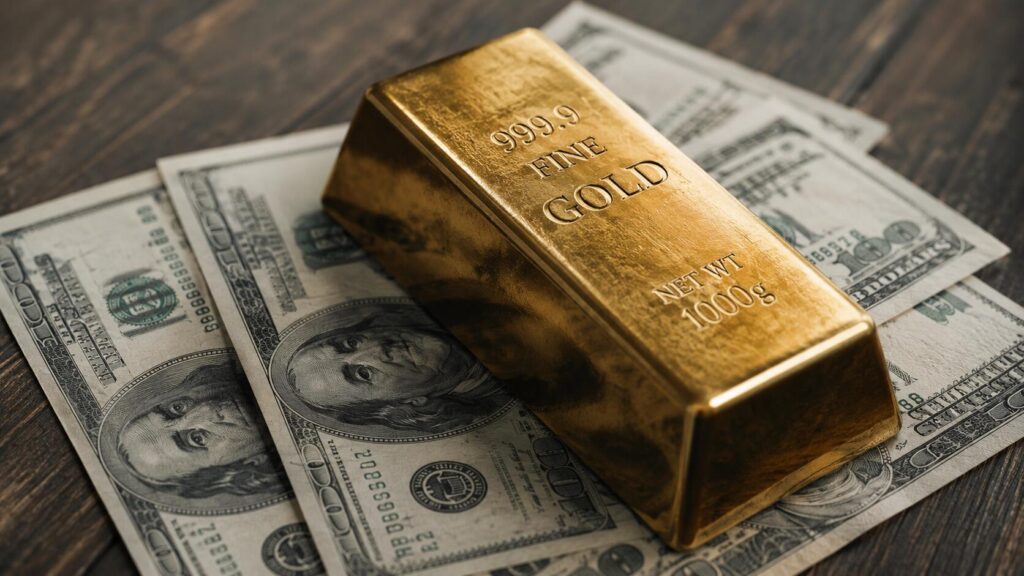
Gold went from $35 in 1971 to around $4,500 today — a 12,000% gain since the gold standard ended. Meanwhile, the dollar lost 96.9% of its purchasing power over the same period. These are not two separate stories. This is the complete gold price history: decade by decade, the real cause behind every major move, and what a century of data tells investors right now.
The Debasement Trade Explained: Mechanism, History, and What It Means for Gold
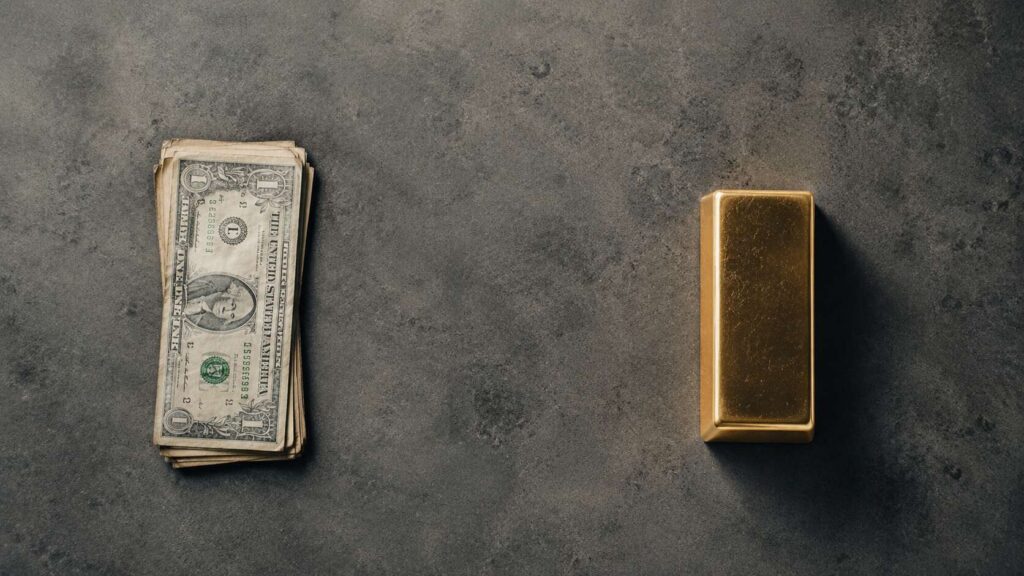
Five years ago, “debasement trade” was Austrian economics jargon. Today Goldman Sachs, Citi, and J.P. Morgan use it in their research notes. Here’s what it means, why it works, and why gold and silver are the primary instruments.
The Gold Market Is Mostly Paper. Dubai Disagrees.
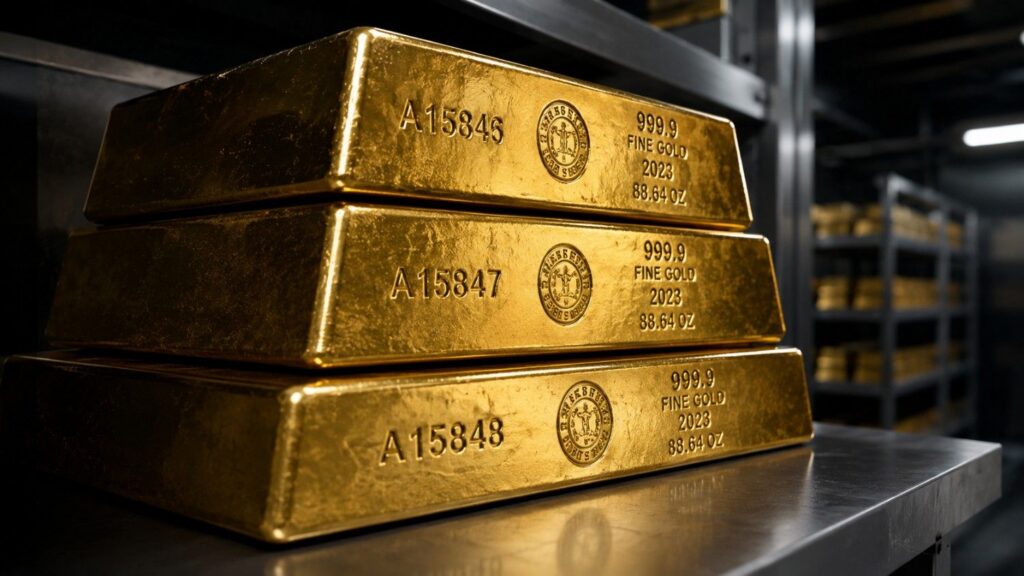
Most gold doesn’t move when it’s “traded” — it changes hands as a ledger entry in an unallocated account. A new report shows Dubai is building a different system entirely, where ownership means a specific bar, not a claim on a pool. Here’s what the difference means for your portfolio.
Gold Silver Ratio Forecast (75): Buy Gold, Add Silver, or Wait?
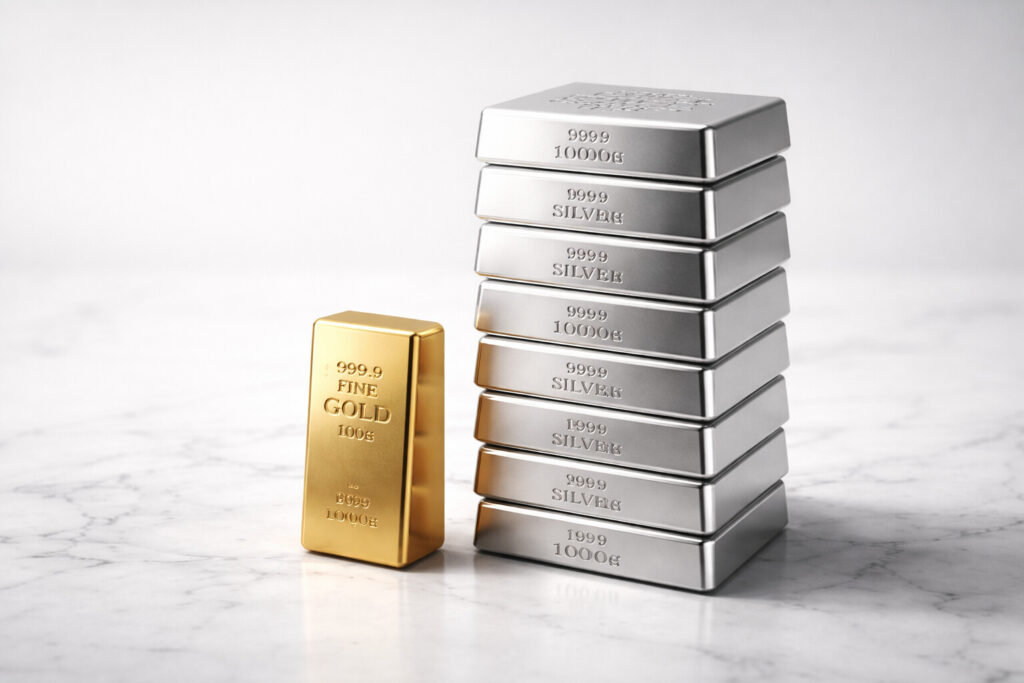
A gold-silver ratio of 75 signals silver is historically undervalued relative to gold. Discover what the data says, which metals to buy, and how to allocate your precious metals portfolio with confidence.
How to Read the Gold-Silver Ratio — And What to Do About It
The gold-silver ratio is one of the most practical tools in precious metals investing. It tells you when one metal is historically cheap relative to the other — and gives you a framework for acting on that signal without guessing at price direction.