Published: 06-09-2026, 04:26 pm
For 90 years, gold has moved in a predictable tide between the Western financial system and Eastern physical holders. Here is how it works — and why it is changing.
Key Takeaways
- Gold has a stock-to-flow ratio of around 60. Annual mine supply barely moves the price — who owns the existing metal does.
- The West sets the marginal gold price. The East absorbs weakness and sells into strength.
- London clears the global wholesale market. Switzerland recasts bars between formats. COMEX delivers.
- The TIPS-gold correlation ran at 84% from 2005 to 2021. It collapsed to 3% in 2022 and 2023.
- Central banks bought 1,082 tonnes in 2022 — the highest pace since 1950. The buying has continued every year since.
Most investors think they understand gold. They know it goes up when the dollar weakens. They know the Federal Reserve matters. China buys a lot of it — everyone knows that.
What most investors do not know is the plumbing. And in the gold market, the plumbing is everything.
A researcher named Jan Nieuwenhuijs spent years mapping the hidden architecture of the global gold market. His framework was published in 2020 and updated in 2022. It revealed something both simple and striking: for roughly 90 years, gold has moved in a recurring tide between the Western financial system and Eastern physical holders. Understanding this tide is one of the most useful mental models an investor can carry.
Here is how it works.
Why Does Gold Move Differently From Other Commodities?
Gold is not priced like copper, wheat, or oil. With most commodities, annual production heavily influences price. When supply tightens, prices rise. When demand falls, prices fall. The math is relatively straightforward.
Gold operates on entirely different logic. Above ground, roughly 208,000 tonnes of gold exist. Annual mine production adds approximately 3,500 tonnes per year. That gives gold a stock-to-flow ratio of around 60. The total existing supply is 60 times larger than what mines produce in a year. As a result, new mining has very little impact on the overall supply picture.
Therefore, the real price driver is not what comes out of the ground each year. Instead, it is who already owns the metal, who is willing to sell it, and at what price the world’s major financial centers are willing to clear that trade.
In other words, gold behaves more like a currency than a commodity. It is reshuffled, reallocated, recast, and repositioned across the global financial system. The ebb and flood of that repositioning is what drives the price.
The Knowledge That Changes Everything
Two essential guides — yours free. Understand why gold matters and why fiat currencies always fail.
How Does the West Set the Gold Price?
In the Western financial system, gold competes directly with paper assets. Specifically, it competes with real yields — the inflation-adjusted return on safe government bonds. When real yields are low or falling, holding gold is relatively cheap. Investors rotate in. When real yields are high or rising, holding a non-yielding asset becomes costly. Investors rotate out.
This relationship was remarkably consistent for nearly two decades. According to RBC Wealth Management, the statistical correlation between gold and 10-year TIPS yields ran at roughly 84% from 2005 to 2021. Almost every macro desk in the world had some version of the same chart: real yields up, gold down. Real yields down, gold up.
The Western mechanism works primarily through institutional money. Hedge funds, ETFs, pension allocators, and bullion banks move large quantities of paper gold and physical metal in response to these yield signals. London, the global hub for wholesale gold settlement, is where most of this clearing happens.
Meanwhile, Switzerland acts as the plumbing between market formats. The London Bullion Market Association standard for institutional gold settlement is a 400-troy-ounce good delivery bar. COMEX in New York, however, requires 1-kilogram or 100-ounce bars. Swiss refineries have historically served as the conversion point between the two systems. When gold flows between London and New York, it typically passes through Switzerland to be recast into the required format.
This triangular system — London pricing, Swiss recasting, COMEX delivery — is the backbone of Western gold mechanics.
Why Does Eastern Demand Absorb Gold When Prices Fall?
The East approaches gold from a completely different cultural and financial starting point.
In China, India, Thailand, the Middle East, and large parts of Southeast Asia, gold is not a portfolio allocation. It is savings, inheritance, and emergency money. It is wedding money and generational wealth stored outside the banking system. Eastern buyers tend to be patient, price-sensitive, and deeply physical. They do not chase prices higher in the same way Western institutional money does.
Instead, Eastern demand responds inversely to price. When gold rises sharply, Eastern physical demand typically stalls or even reverses. Buyers step back. In some markets, existing holders cash in their metal to take advantage of elevated prices. When gold falls, Eastern buyers return. They quietly accumulate physical metal at levels they consider fair.
Bangkok’s Yaowarat gold district is one of the clearest visible examples of this behavior. The gold shops there are not simply jewelry stores. They are liquid miniature balance sheets for household wealth. When gold spikes, people queue to sell. When gold dips, people queue to buy.
This is the mechanism that makes Eastern demand the market’s ballast. The West provides the engine — institutional money that drives directional moves. The East provides the floor — long-horizon physical buyers who absorb dishoarding and stabilize the market over time.
People Also Ask
Is gold a commodity or a currency?
Gold is classified as a commodity on exchanges, but it trades more like a currency. Unlike oil or wheat, where annual production heavily influences price, gold’s above-ground stock is roughly 60 times larger than yearly mine output. Price is therefore driven by who owns existing metal and who wants to buy or sell it — the same logic that governs currency markets, not commodity supply cycles.
Why do gold prices rise when real interest rates fall?
Gold pays no yield. When inflation-adjusted interest rates on government bonds fall, the opportunity cost of holding gold also falls — making it relatively more attractive compared to yield-bearing assets. This relationship held at an 84% statistical correlation from 2005 to 2021, according to RBC Wealth Management. Since 2022, however, additional structural buyers — particularly central banks — have reduced gold’s sensitivity to this single driver.
Why are central banks buying so much gold?
Two structural forces are driving it. First, the 2022 freezing of Russia’s dollar-denominated reserves demonstrated that sovereign assets held in foreign custodial systems can be immobilized. Gold held outside those systems cannot. Second, many central banks — particularly in Asia and emerging markets — are diversifying reserves away from a heavy concentration in US dollar assets. According to the World Gold Council, central banks purchased more than 1,000 tonnes annually in 2022, 2023, and 2024.
What does London actually do in the gold market?
London is the global hub for wholesale gold settlement. The London Bullion Market Association (LBMA) sets the international standard for institutional gold bars at 400 troy ounces. Bullion banks, ETF custodians, central bank reserves, and institutional investors clear most of the world’s physical gold allocation through London. When the UK reports large net gold imports or exports, it reflects institutional demand — not retail buying. It is the most direct window into where Western professional money is positioned on gold.
Does Eastern gold demand drive the gold price higher?
Historically, Eastern physical demand has acted as a floor rather than an accelerator. Eastern buyers — in China, India, Thailand, and across the Middle East — tend to be price-sensitive and patient. They buy when prices fall and step back when prices rise sharply. The West has historically set the direction of price moves through institutional demand. The East has absorbed the correction. Since 2022, this pattern has partially shifted: Eastern central banks have been significant buyers even as prices rose, contributing to the breakdown of the old Western price-setting model.
Stay On Top of Gold & Silver Prices
Get important market alerts sent straight to your inbox.
What Is London’s Role in the Global Gold Market?
London is the center of the global wholesale gold market. This might seem counterintuitive. The United Kingdom does not mine meaningful quantities of gold. British retail demand is negligible in global terms.
However, when the UK reports large net gold imports or exports, it reflects the London Bullion Market breathing. Institutional flows, custody movements, bullion bank activity, and physical metal responding to financial market pressures all clear through London.
As a result, the UK’s net physical gold flow is one of the clearest windows into the deeper mechanics of the global market. When the West wants gold, London absorbs metal. When the West is done with gold, London redistributes it.
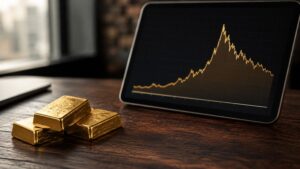
The COVID-19 period in 2020 illustrated these mechanics in unusually sharp detail. Passenger flights were grounded. Gold transport became severely disrupted. COMEX futures traded at a substantial premium to London spot prices as arbitrageurs struggled to physically move metal from Europe to the United States for futures delivery. Swiss refineries temporarily closed or curtailed operations.
The result was a dislocation that reminded the entire market of something easy to forget. Gold can be traded on a screen in milliseconds. At the end of the chain, however, someone still needs to move the bars.
Gold’s real-yield correlation is breaking down
Statistical correlation (R²) between gold price and 10-year US TIPS yield, by period
84%
Strong inverse
correlation
3%
Correlation
collapses
7%
Structurally
lower floor
Source: RBC Wealth Management / World Gold Council / goldsilver.com/price-charts/
Why Has Gold Stopped Following Real Yields?
This is the question that matters most for investors right now.
From 2022 onward, the old real-yield model has become notably less reliable. Real yields rose sharply in 2022 and 2023. Under the old regime, gold should have fallen meaningfully. Instead, it proved far more resilient than the model predicted.
The numbers are striking. According to RBC Wealth Management, the TIPS-gold correlation collapsed from 84% during 2005 to 2021 to just 3% in 2022 and 2023. Since 2024, it has recovered slightly but remains near 7%. J.P. Morgan Private Bank described the resulting dynamic in early 2026 as "asymmetric": gold rises when real yields fall, but falls considerably less than the old model would predict when real yields rise.
Two forces appear to be driving this change. First, central bank buying has accelerated dramatically. According to the World Gold Council, central banks purchased 1,082 tonnes in 2022 — the highest annual total since 1950 — followed by 1,037 tonnes in 2023 and approximately 1,045 tonnes in 2024. That three-year pace roughly doubled the prior decade's average. Many of these purchases were made by emerging market central banks. They sought to reduce dollar-denominated exposure and build reserves outside the Western settlement system.
Second, the 2022 freezing of Russian sovereign reserves demonstrated to policymakers globally that dollar-denominated assets can be immobilized with a legal order. Gold held outside custodial arrangements cannot be frozen in the same way. This insight accelerated reserve diversification across dozens of central banks simultaneously.
In combination, these forces mean the old headwind from higher real yields is still present. However, it is now partially offset by a structural bid that did not exist in the old model. The West is still setting the weather in the gold market. However, the ocean floor has shifted.
What Does the Real-Yield Breakdown Mean for Gold Investors?
For investors, the practical implication is significant. The old playbook said: watch real yields and the dollar, and gold will follow. That still matters. But it is no longer the whole story.
Gold appears to be in a transition. It is being repriced from a tactical inflation hedge into a strategic monetary reserve asset. Central banks, sovereign wealth funds, and major institutional allocators are treating it differently than they did a decade ago. The accumulation is not tactical — it is structural, and it is multi-year.
For individual investors holding physical gold, the East-West framework offers a useful lens. Eastern demand has historically provided the floor. The patient, long-horizon physical buyer absorbs excess supply over time. When Western institutions sell, Eastern holders buy. The tide runs both ways.
What Does This Mean for the Individual Investor?
Meanwhile, the Western repricing — driven increasingly by fiscal concerns, reserve diversification, and loss of confidence in the paper claims around gold — represents the new engine. Gold is not just trading the level of real rates anymore. To an important degree, it is now trading the credibility of the balance-sheet architecture behind those rates.
For individual investors holding physical metal, structural context matters more than any single price move. Sound money has always preserved purchasing power over monetary cycles. The mechanism operating today is not new. It is the same mechanism that has operated for centuries — now playing out in a global financial system where the old anchors are being quietly reassessed.
Understanding that mechanism is not pessimism. It is preparation. And it is exactly why the individual investor with physical gold in hand is better positioned than one watching from the sidelines with a paper proxy.
Own the metal. Understand why. Sleep soundly. The tide has been running for 90 years. It is not stopping now.
SOURCES
1. Jan Nieuwenhuijs — The West-East Ebb and Flood of Gold
2. RBC Wealth Management — Gold's Regime Change?
3. J.P. Morgan Private Bank — Is It a Golden Era for Gold?
4. World Gold Council — Gold Demand Trends: Full Year 2024, Central Banks
5. London Bullion Market Association — The OTC Guide: Frequently Asked Questions
6. CME Group — Gold Futures
Disclaimer: This article is for informational purposes only and does not constitute financial or investment advice. Always consult a qualified financial adviser before making investment decisions.
You may also like:
- Does Physical Gold Have Counterparty Risk? The Facts
- Why Is Gold Still a Safe Haven? Switzerland’s Biggest Refiner Just Answered.
- Rate Hike Odds Just Hit 85%. Gold Is Up. Here’s Why.
- Gold Confiscation: Could the Government Take Your Gold Again?
- Gold Price History: From $35 to $4,500 in 100 Years
- The Debasement Trade Explained: Mechanism, History, and What It Means for Gold
- Gold or Silver First? A First-Time Buyer’s Framework
- Gold Reserves by Country: The 2026 Rankings
- Gold Portfolio Allocation: Why Wall Street Is Rewriting the 60/40
- What Does the SILVER Act Mean for Precious Metals Investors?