 Silver Rises Over 120% YTD




Should You Sell Gold During a Bull Market Pullback?

Gold has pulled back 16% from its January 2026 all-time high — but history shows that selling during a bull market pullback has repeatedly cost investors the next major leg higher. Here’s how to decide.
Is Gold Still a Strategic Asset for Your Portfolio?

Gold is 16% off its all-time high but up 42% year-over-year. The 60/40 portfolio is broken, central banks bought 863 tonnes in 2025, and Goldman Sachs targets $5,400. The strategic case hasn’t weakened — it’s grown stronger.
Dollar Weakens, Gold Falls — and That’s Actually Bullish

The US just froze Iraq’s own oil dollars. Iran seized ships in the Strait of Hormuz. Gold fell anyway. The reason is a specific chain reaction most coverage misses — and once you understand it, the price action looks very different.
The Gold-Silver Ratio Signal: What Silver’s Lead Means
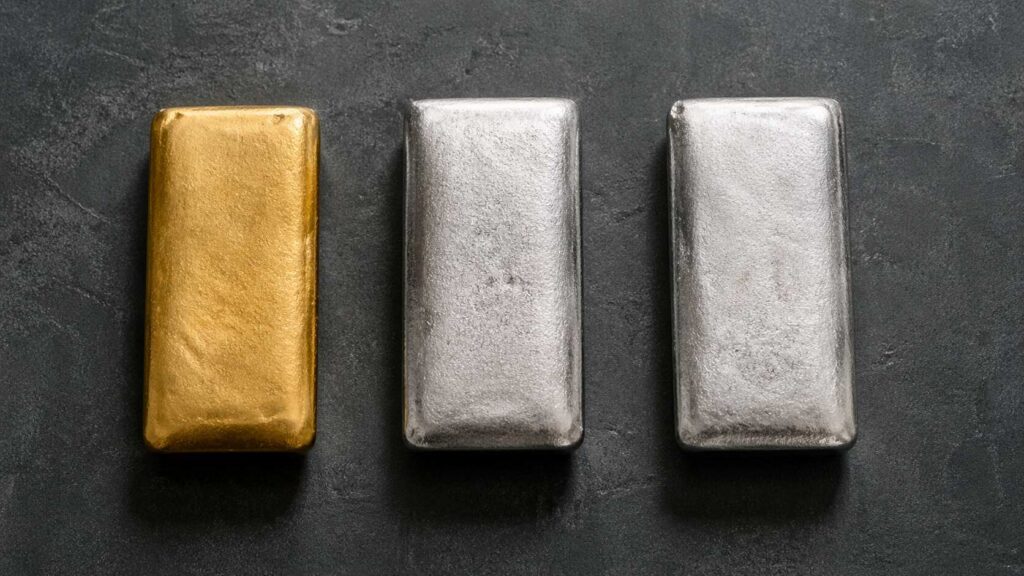
Silver is up 2% while gold gains 1%. The gold-silver ratio is tightening. Most investors miss what that gap is actually signalling — here’s the full picture.
Gold/Silver Ratio Hits 61.1 — Silver’s Turn to Run

Silver is outpacing gold for the second straight day as the gold/silver ratio compresses to 61.1. With a six-year supply deficit, stagflation signals, and central bank buying accelerating, silver’s structural case is finally finding its moment.
The 1970s Gold & Silver Bull Run: Causes, Returns, and Lessons for Investors
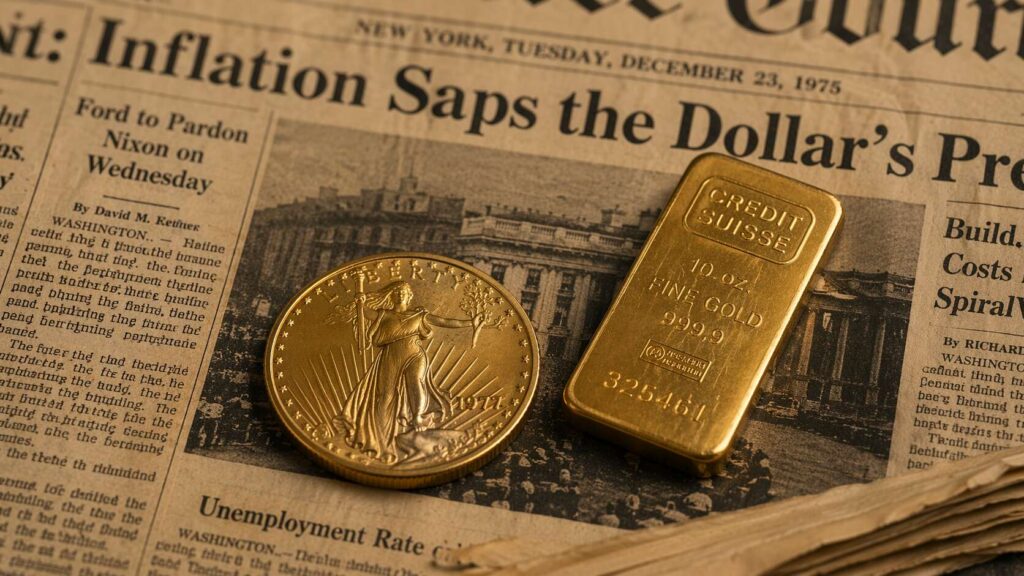
The 1970s gold and silver bull run remains one of the most dramatic wealth events of the 20th century. Gold rose 2,300%. Silver gained 400% in a single year. Understanding what drove that decade-long move — and what finally ended it — gives modern investors a precise framework for reading today’s precious metals market.
What the Silver-to-CPI Ratio Reveals That Spot Price Hides
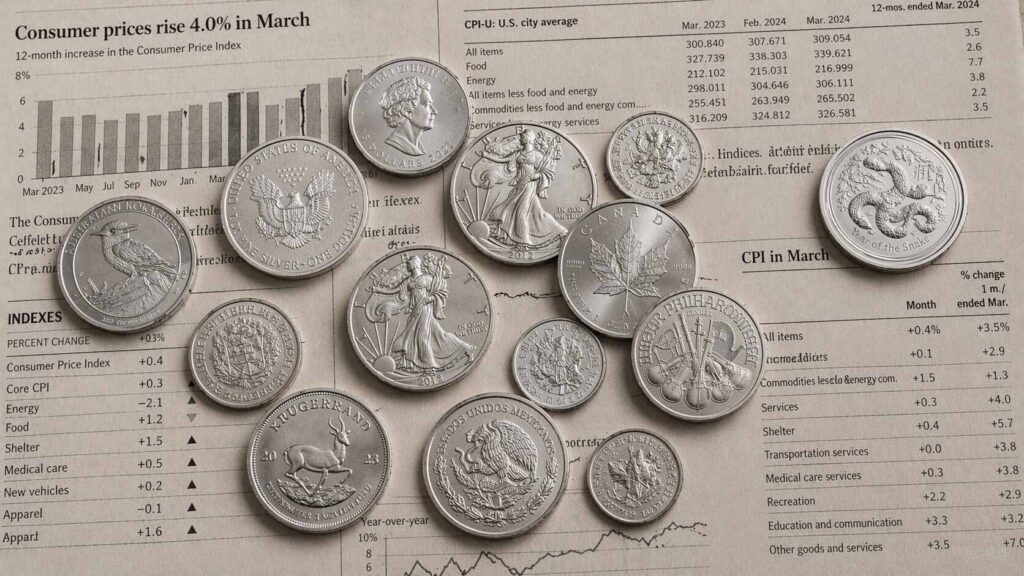
Silver hit a nominal all-time high of $121.64 in January 2026 — yet the silver-to-CPI ratio tells a different story. Adjusted for inflation, silver remains well below its 1980 peak and barely above its 2011 cycle high. Here’s what the ratio reveals that spot price alone never can.
Dow to Gold Ratio: 100 Years of History Decoded

Gold has gained roughly 15.6% since January 1, 2026, while the Dow is up just 2.7% over the same stretch. That gap doesn’t register in most financial headlines — but the Dow to gold ratio captures it with precision. Right now, the ratio reads approximately 10: it takes around 10 ounces of gold to match one unit of the Dow index. At the dot-com peak in 1999, it took 43. What does that shift tell us, and where does it go from here?
Gold Outranks the Dollar at Central Banks — What It Means for Your Savings
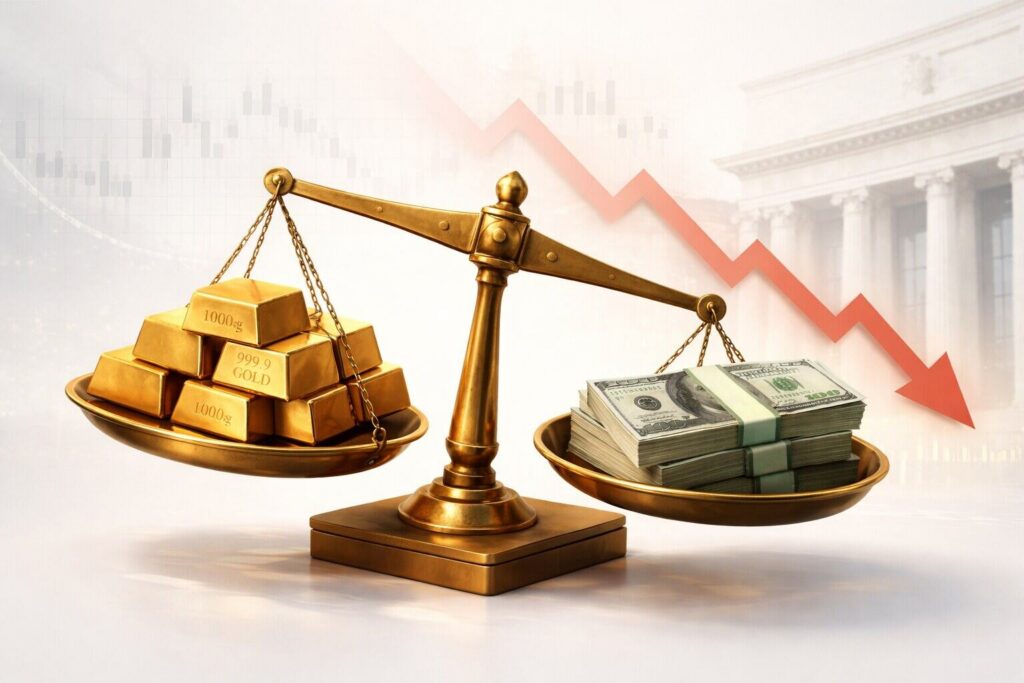
For the first time since the collapse of Bretton Woods, central banks now hold more gold than dollars — $3.87 trillion vs. $3.73 trillion. Here’s what that structural shift means for your savings.
$88 Billion a Month: Why U.S. Debt Is Driving Gold Prices
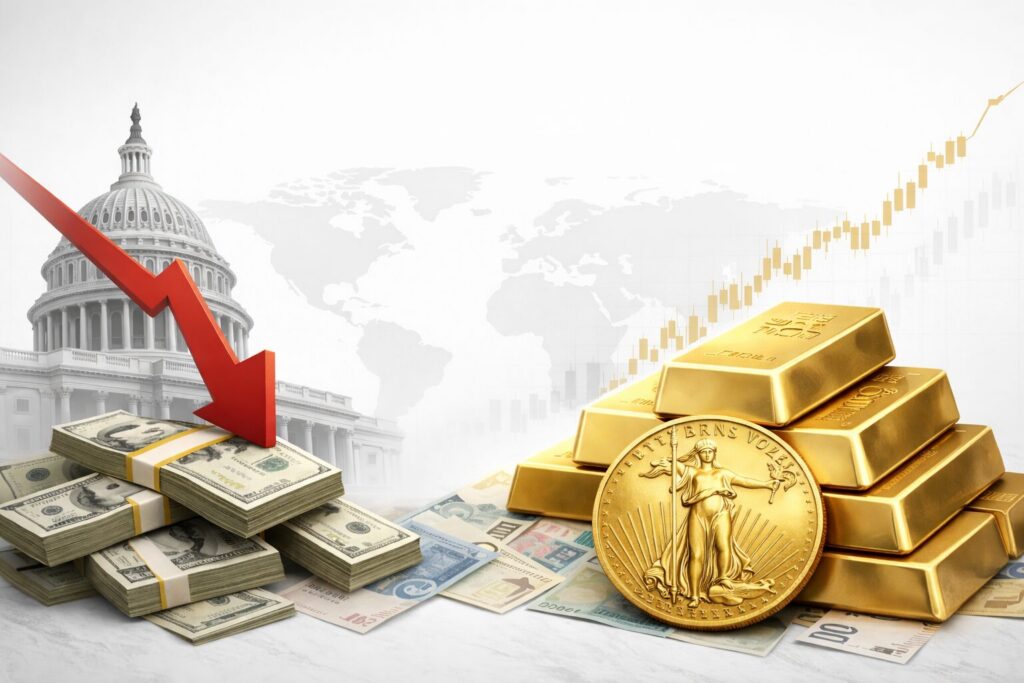
Does US debt drive gold prices? The CBO confirmed the U.S. paid $529 billion in interest in just the first half of fiscal 2026 — $88 billion a month. Gold is at record highs and climbing. Here’s the fiscal mechanism every saver needs to understand before the next $88 billion bill arrives.


