 Silver Rises Over 120% YTD




14 Million Coins Sold. Zero Design Changes in 35 Years. Here’s Why Investors Keep Choosing the Philharmonic.

The Austrian Gold Philharmonic has been struck in .9999 fine gold by the Münze Österreich every year since 1989. Over 14 million coins have been distributed worldwide. Here is what serious buyers need to know about its specifications, IRA eligibility, premium structure, and how it compares to the American Gold Eagle.
Five Unrelated Forces All Moved Gold and Silver Higher Today. That Doesn’t Happen Often.
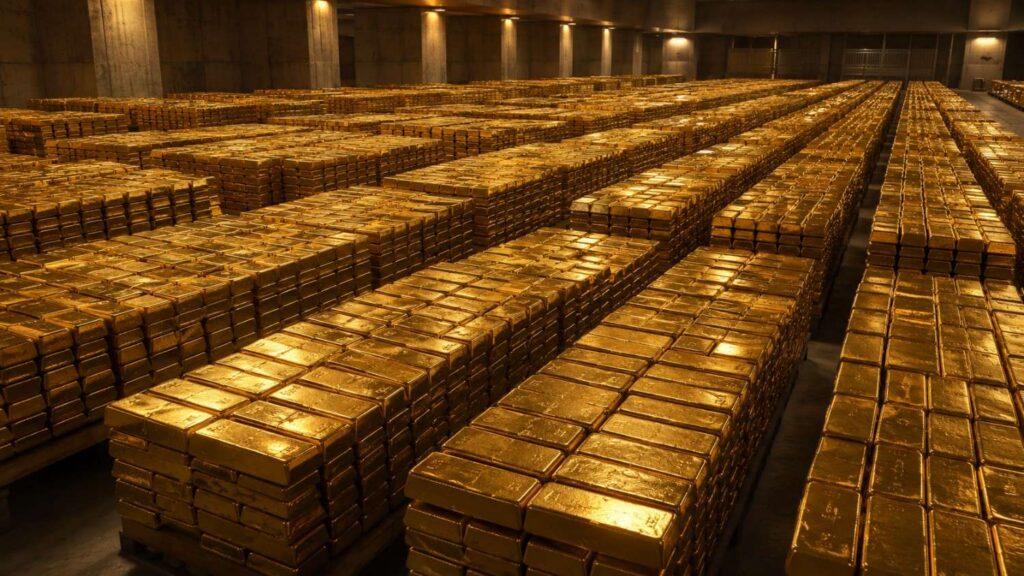
Five unrelated forces moved gold and silver higher on August 12, 2026 — and their convergence on a single session is rarer than it looks. July CPI landed clean, China’s central bank extended its record 21-month buying streak, gold entered overbought territory for the first time since March, silver’s dual engines fired simultaneously, and the Strait of Hormuz remains closed. Here is what each one means.
Why the Krugerrand Has No Face Value — and Why That’s the Point
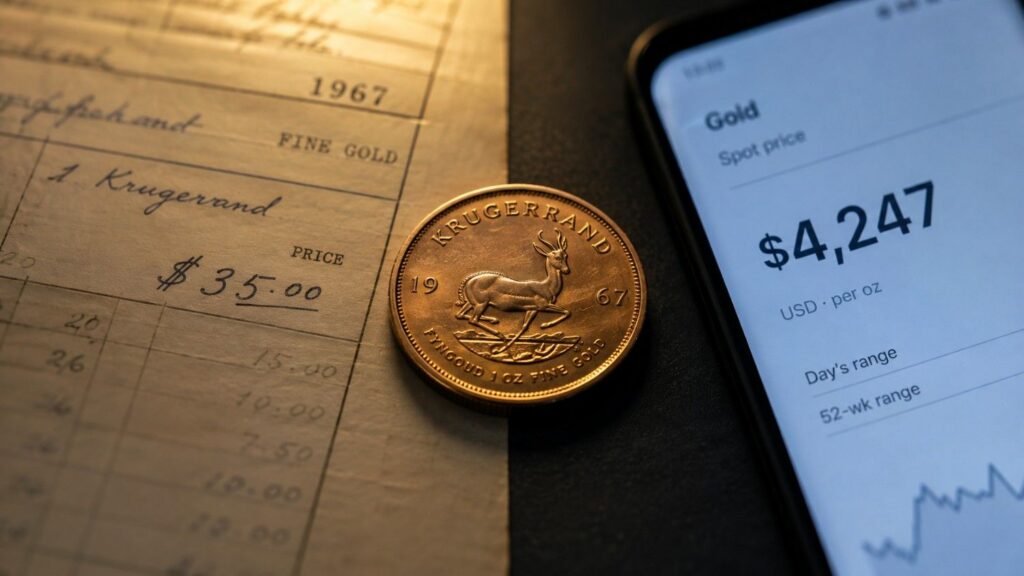
The South African Krugerrand is the world’s first gold bullion coin — and one of its most deliberately designed. Launched in 1967 with no face value by intention, it cannot be debased by monetary policy. Here is how it works, why it was banned, and why nearly six decades later it remains the most liquid gold coin on the planet.
M2 Money Supply: The Number That Makes Your Portfolio Meaningless
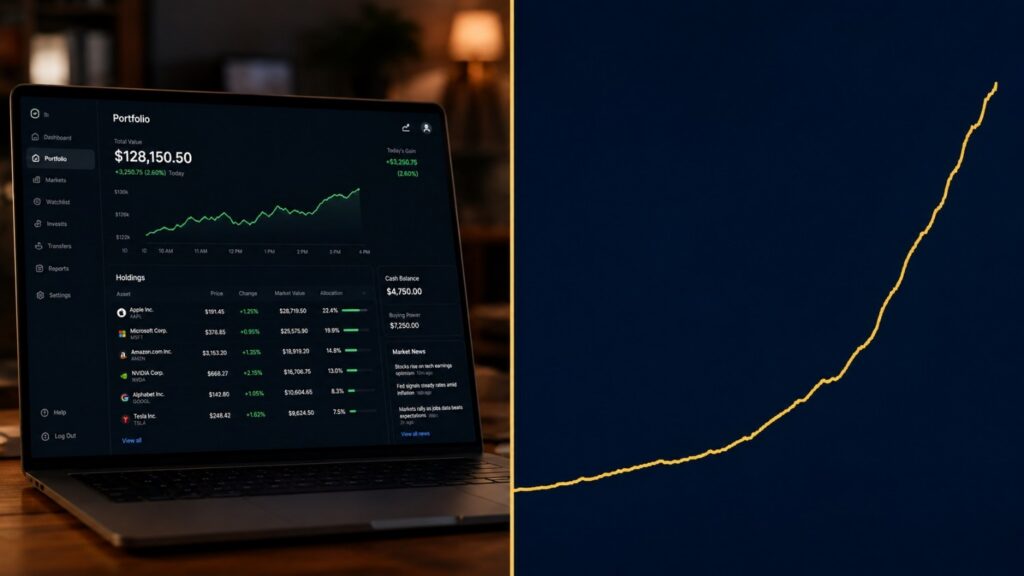
Most investors check their portfolio every day. Very few have ever looked at a chart of M2 money supply. That gap — between what feels important and what actually is — turns out to be one of the most expensive mistakes a long-term saver can make. Here is what M2 is, why it grew 55 percent since 2020, and why it tells you something your portfolio never will.
The Canadian Gold Maple Leaf: Purer Than the Eagle, Lower Premium, and IRA-Eligible
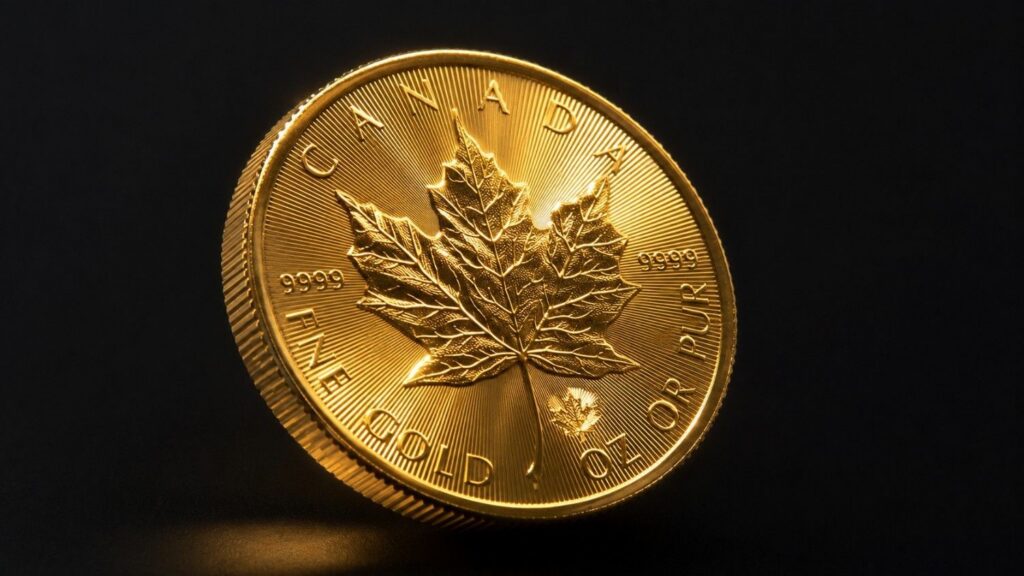
The Canadian Gold Maple Leaf is 99.99% pure gold, carries a lower dealer premium than the American Gold Eagle, and qualifies for a Gold IRA without a congressional exemption. Here is what the purity standard, security features, sizing options, and sound money case look like for investors considering physical gold ownership.
Gold Fell 47 Percent in the 1970s Before Its Biggest Run. The Chart Looks Like Right Now.

In the middle of the 1970s gold bull market, gold fell 47 percent. Most investors sold. The ones who held watched it run nearly eight times from that low to the January 1980 peak. GoldSilver’s Megan King Diaz walks through the historical chart — and draws the parallel to where gold sits right now.
State Street Predicts $5,500 Gold by Q1 2027: Is the Dip Over?

State Street’s July 2026 Monthly Gold Monitor targets $5,000 per ounce into early 2027, with a 70% probability baseline range of $4,750–$5,500. Here is the structural case behind the forecast — record global debt, central bank buying, and a stock-bond correlation breakdown — and what a gold recovery means for silver’s high-beta setup.
Why China’s Gold Buying Spree Outweighs India’s Pause
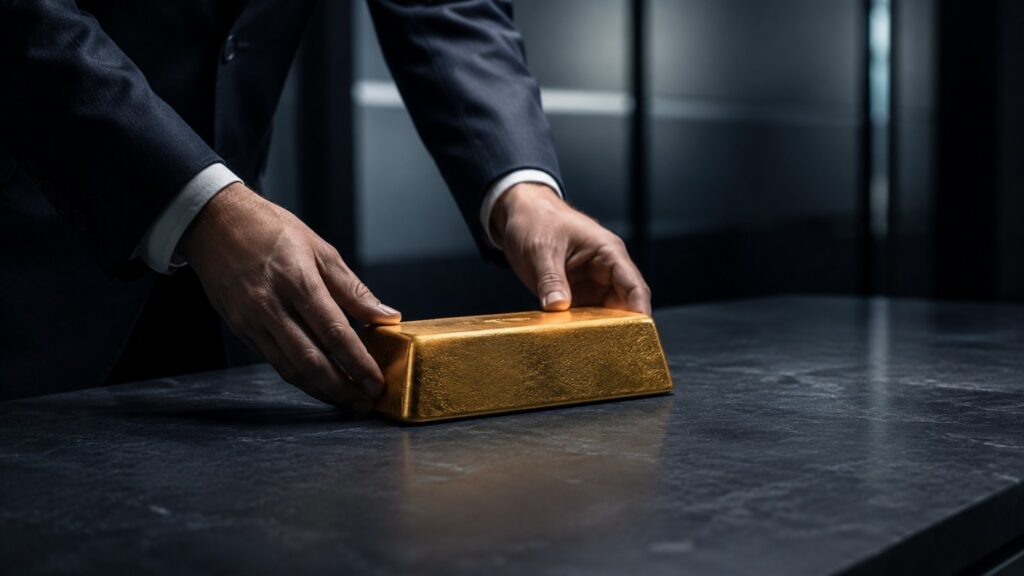
China’s bar and coin gold demand hit a record 207 tonnes in Q1 2026 while India paused on a 15% import duty hike. Here’s why the divergence matters — and what it means for your physical gold allocation.
What Is Purchasing Power — and Why Every Dollar You Save Is Slowly Being Taxed Away
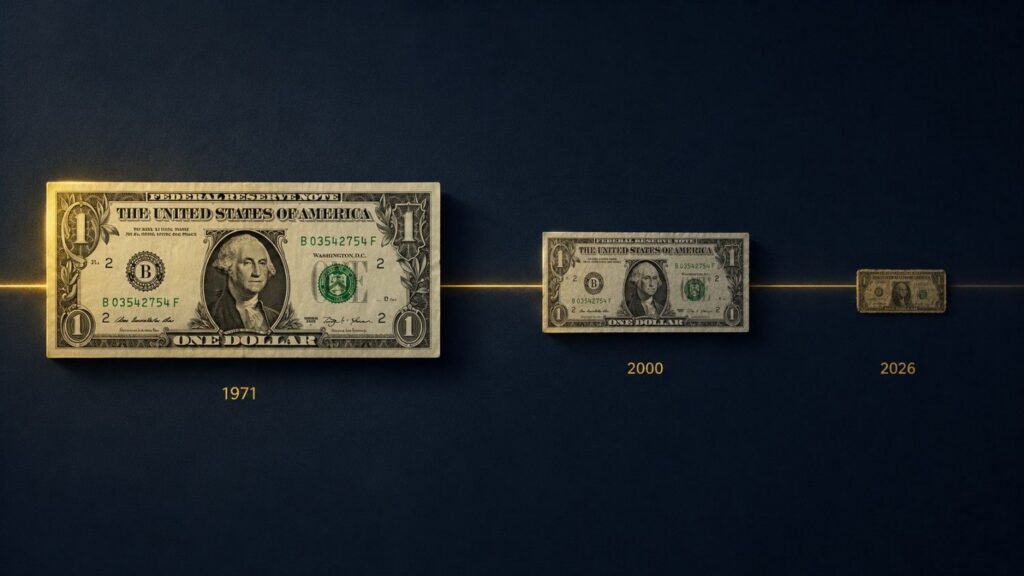
The dollar has lost 87% of its purchasing power since 1971. Learn what purchasing power actually is, why fiat currency erodes it, and why gold doesn’t.
Gold Went Up 600%. Your Mining Stocks Didn’t. Here’s Why.

Gold went up 600% since 2006. Junior miners are still negative over the same period. Rob McEwen — the operator who built Goldcorp into a multi-billion dollar producer — explains the exact mechanism behind the gap, what finally closes it, and why mining stocks at 2% of global equity may be the setup of the decade.


