Silver Rises Over 120% YTD


1980’s Misery Index Hit 22. Here’s Where We Actually Stand Today.

The 1970s misery index peaked at 22. Today’s number is a fraction of that, but the fight brewing at the Fed says the comparison isn’t over yet.
Rate Hike Odds Just Hit 85%. Gold Is Up. Here’s Why.
Rate hike odds just hit 85%. Gold is up anyway. Most headlines won’t explain why — because the answer requires flipping the standard model upside down. The number that actually drives gold isn’t the fed funds rate. It’s the real yield. Here’s the mechanism.
Gold Price History: From $35 to $4,500 in 100 Years
Gold went from $35 in 1971 to around $4,500 today — a 12,000% gain since the gold standard ended. Meanwhile, the dollar lost 96.9% of its purchasing power over the same period. These are not two separate stories. This is the complete gold price history: decade by decade, the real cause behind every major move, and what a century of data tells investors right now.
The 1970s Gold & Silver Bull Run: Causes, Returns, and Lessons for Investors
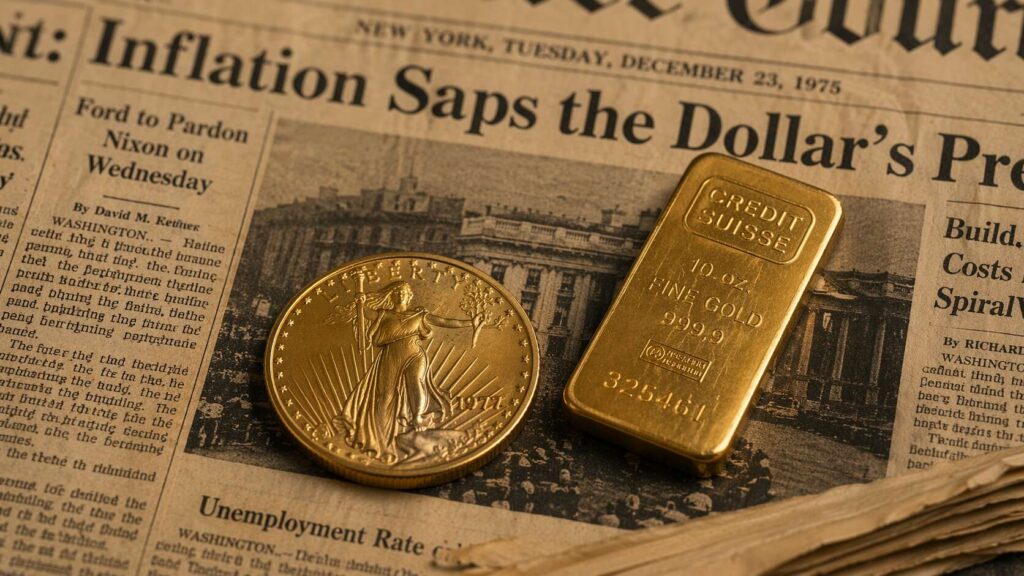
The 1970s gold and silver bull run remains one of the most dramatic wealth events of the 20th century. Gold rose 2,300%. Silver gained 400% in a single year. Understanding what drove that decade-long move — and what finally ended it — gives modern investors a precise framework for reading today’s precious metals market.