 Silver Rises Over 120% YTD




Silver Price Forecast 2026-2027: The bull case and bear case laid out
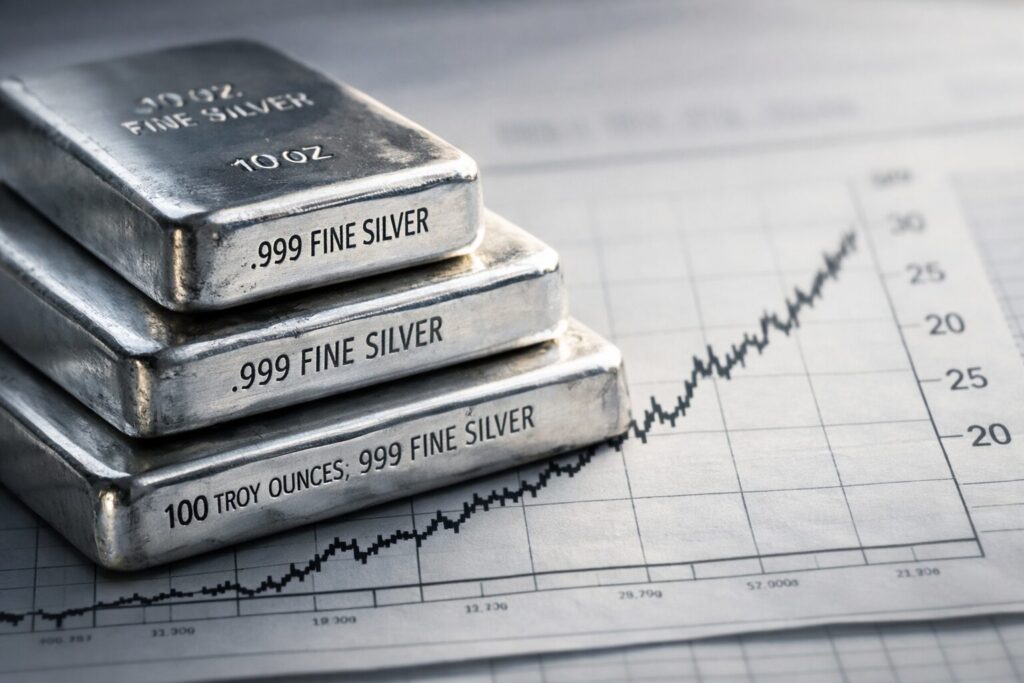
Silver surged 147% in 2025 and hit an all-time high of $121/oz in January 2026. But what comes next? This analysis breaks down the bull and bear case for silver prices in 2026–2027 — covering supply deficits, industrial demand, Fed policy, and institutional forecasts from J.P. Morgan, Commerzbank, and more — so you can make a more informed decision about your precious metals strategy.
Oil Crashed 11%. Gold Went Up. That Tells You Everything.

Oil crashed 11% on Friday when Iran reopened the Strait of Hormuz. Gold went up. That rare divergence — oil down, gold up, same catalyst — signals that gold’s rally is driven by monetary forces, not geopolitical ones. The war premium left oil. The monetary premium stayed in gold. Here is what that means for precious metals investors watching the Fed’s next move.
What the Silver-to-CPI Ratio Reveals That Spot Price Hides
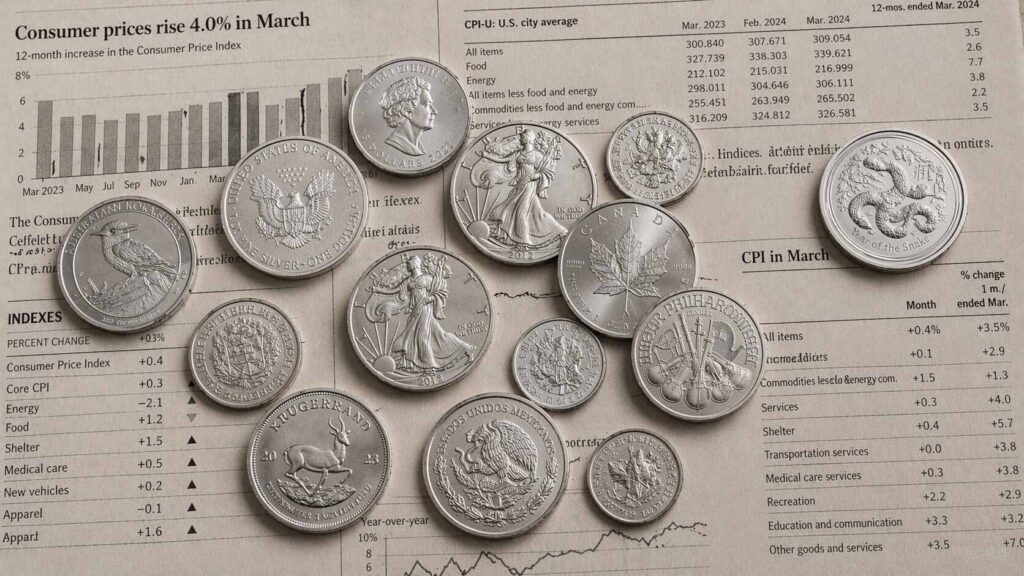
Silver hit a nominal all-time high of $121.64 in January 2026 — yet the silver-to-CPI ratio tells a different story. Adjusted for inflation, silver remains well below its 1980 peak and barely above its 2011 cycle high. Here’s what the ratio reveals that spot price alone never can.
Silver Holds Near $80 as Iran Ceasefire Revives Rate-Cut Bets

Silver surged more than 5% Tuesday and is holding near $80 — the highest level since March. The move isn’t simple. When the US and Israel launched their air campaign against Iran, gold fell 10% instead of rising. The reason was oil, the Strait of Hormuz, and an inflation shock that killed rate-cut expectations. The Iran ceasefire is now reversing all three dynamics at once — and silver is responding through both its monetary and industrial demand channels. Here’s the mechanism, the data, and the one date every precious metals investor should have on their radar.
How the 50 Day SMA Helps You Understand Gold & Silver
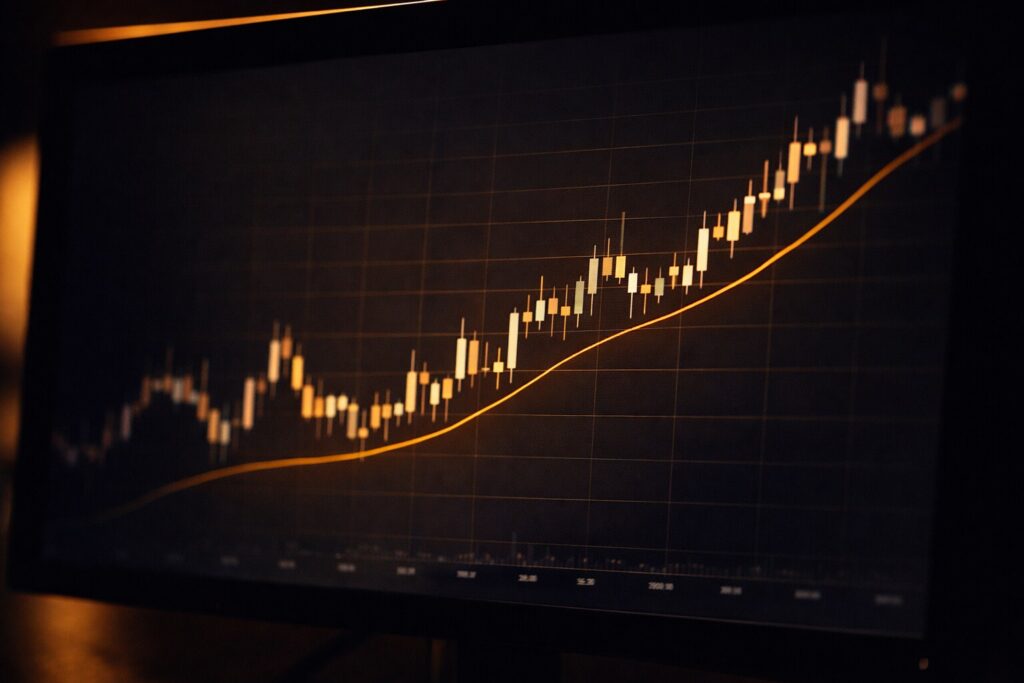
The 50-day SMA is one of the most reliable tools for reading gold and silver price trends. Learn how to use it to identify support levels, spot momentum shifts, and make more confident precious metals investment decisions.
Gold Silver Ratio Forecast (75): Buy Gold, Add Silver, or Wait?
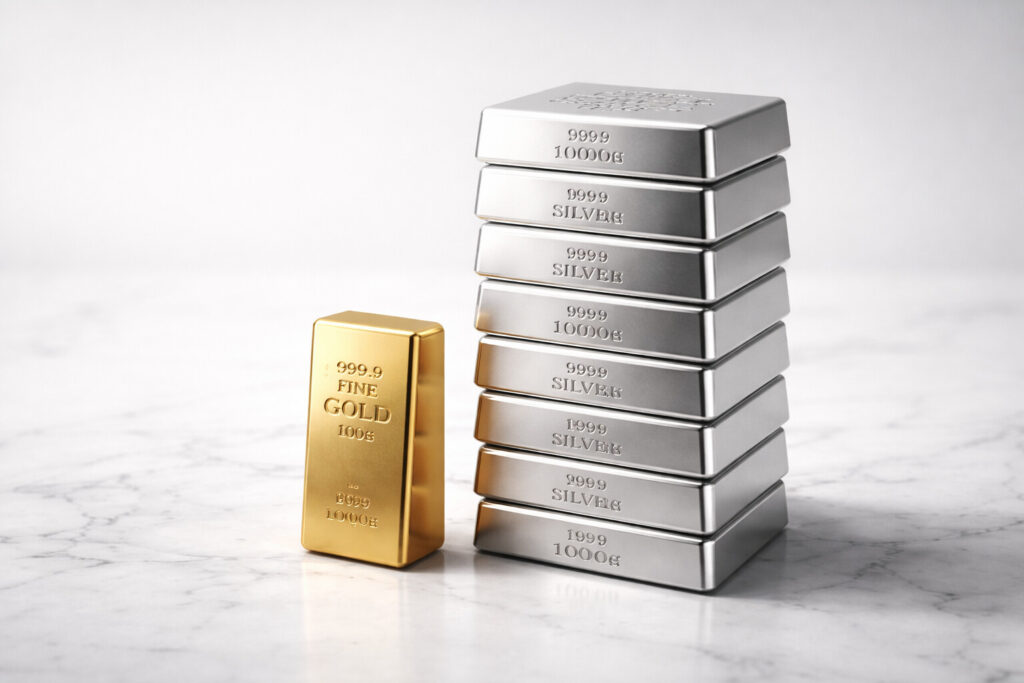
A gold-silver ratio of 75 signals silver is historically undervalued relative to gold. Discover what the data says, which metals to buy, and how to allocate your precious metals portfolio with confidence.
Hormuz Blockade Sent Gold Down 2%. Here’s Why That’s Bullish

The Hormuz blockade sent gold down 2% as oil surged past $100. But margin liquidation — not fundamentals — drove the drop. With CPI at 3.3%, central banks buying, and the petrodollar requiring a navy to defend, the structural case for gold just got stronger.
How to Read the Gold-Silver Ratio — And What to Do About It
The gold-silver ratio is one of the most practical tools in precious metals investing. It tells you when one metal is historically cheap relative to the other — and gives you a framework for acting on that signal without guessing at price direction.
Silver Demand by Sector: Industry, Jewelry & Investment
Silver is often called a dual-use metal — but the real picture has three parts. This breakdown of silver demand by sector shows how industrial applications have quietly taken over, and why that shift matters for anyone holding physical silver.
Is Now a Good Time to Swap Silver for Gold?

Not sure when to swap silver for gold? Learn how to use the gold-to-silver ratio, read market signals, and time your conversion strategically to reduce risk and grow your precious metals portfolio over time.


