Silver Is Up Nearly 5% This Morning. Here Is Exactly Why.
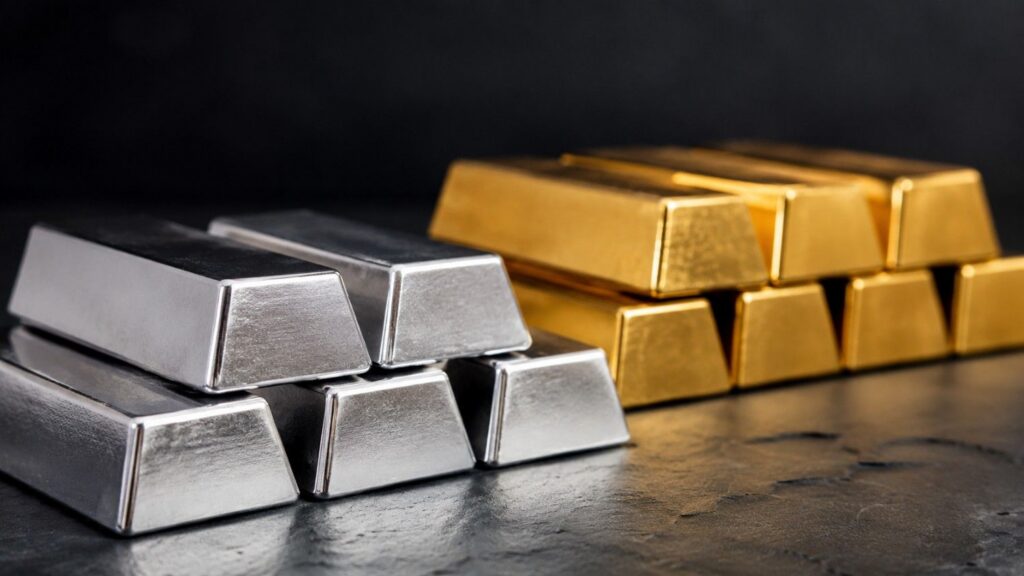
Silver is up nearly 5% this morning as mediators proposed a 10-day ceasefire between the US and Iran — and the mechanism behind the move is specific, teachable, and worth understanding before the next one. Here is the full chain: from oil prices to inflation expectations to the Federal Reserve’s September meeting, and what it means for long-term holders.
Gold Falls as Retail Sales Confirm the Fed Has No Reason to Cut
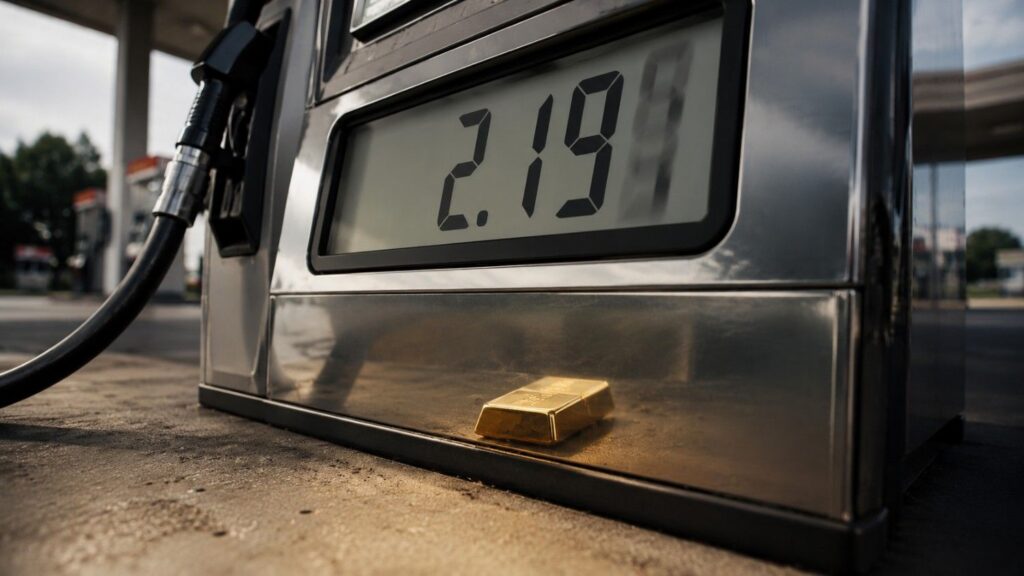
Gold fell to $4,016 and silver dropped 2.6% Thursday after June retail sales printed +0.2%. Strip out gasoline stations — down 5.3% on the month — and the consumer is actually holding up. That’s the problem for gold: a resilient consumer keeps the Fed parked, real yields elevated, and non-yielding metals under pressure.
Silver Dropped 1.4% Today. Gold Didn’t. The Ratio Just Hit 70:1.
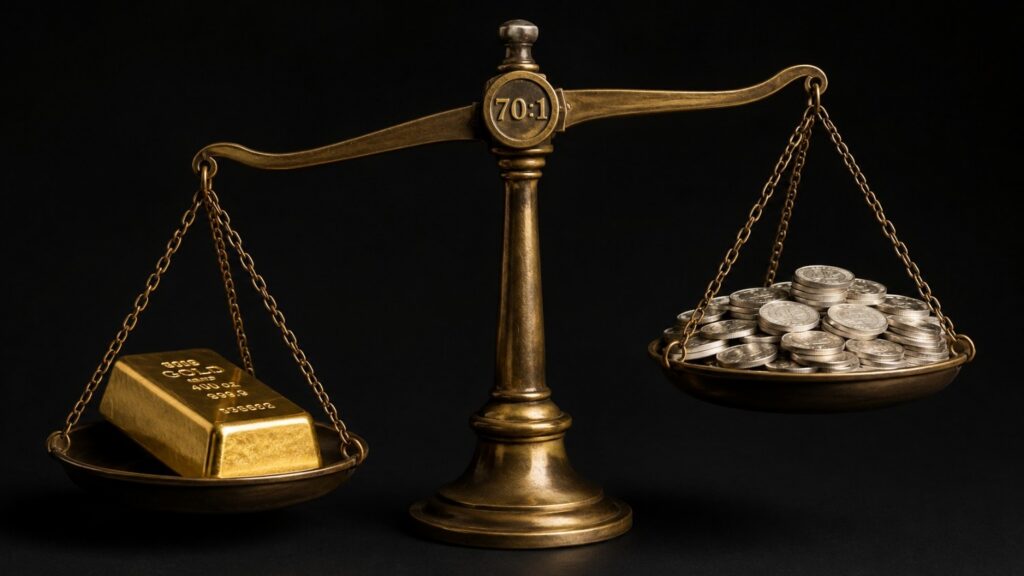
The gold-silver ratio hit 70:1 today as silver fell 1.4% while gold held essentially flat. Here is the mechanism behind the divergence — and the two dates that will likely close the gap.
Gold Is Flat. Oil Is Up 9%. Here’s Why.
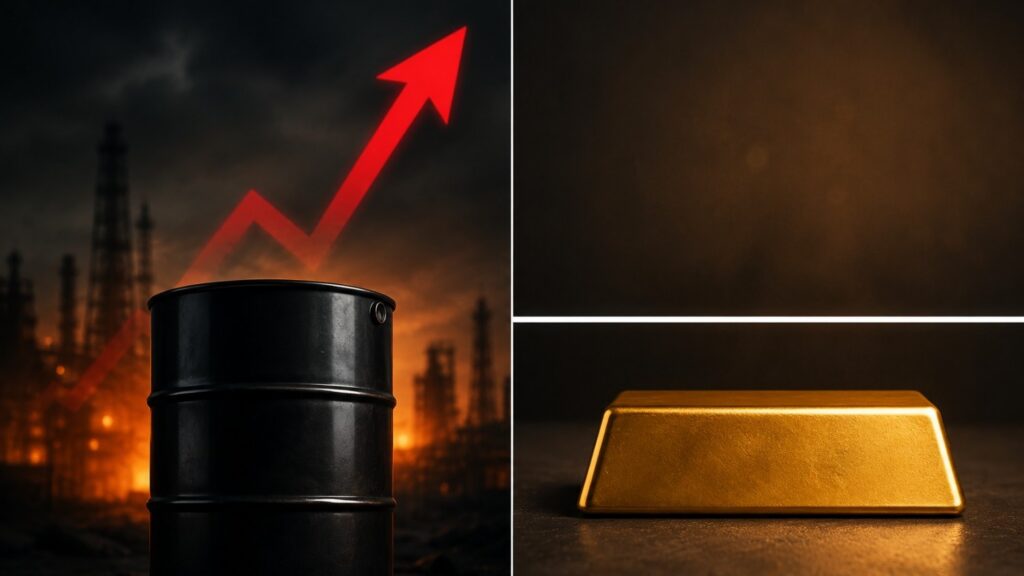
Oil is up more than 9% in five days. The Strait of Hormuz is nearly closed. Gold is flat. That is not a contradiction — it is the difference between supply-chain inflation and monetary inflation, and it matters for every long-term holder.
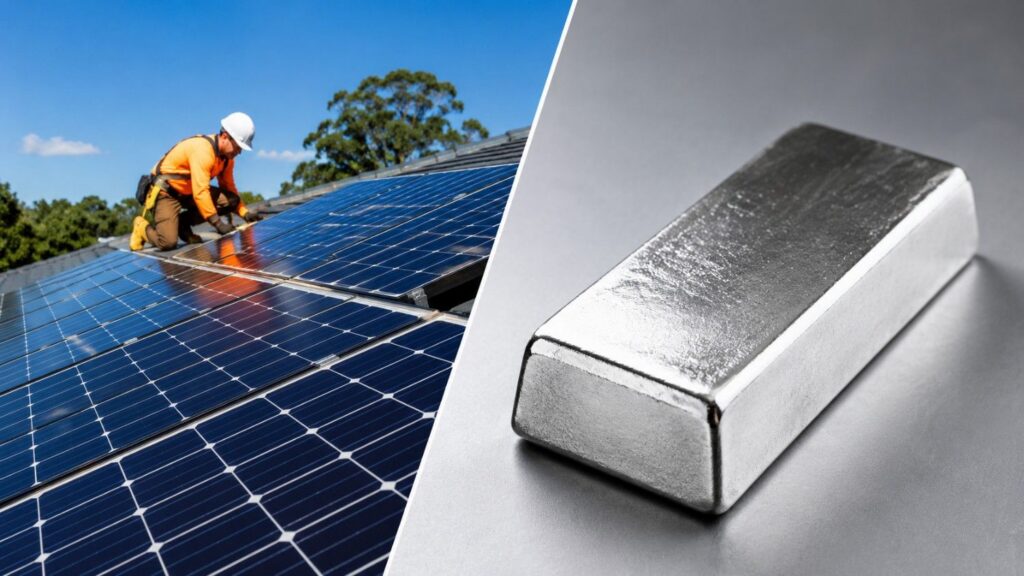
Silver Price Outlook July 2026: Two Catalysts, One Setup
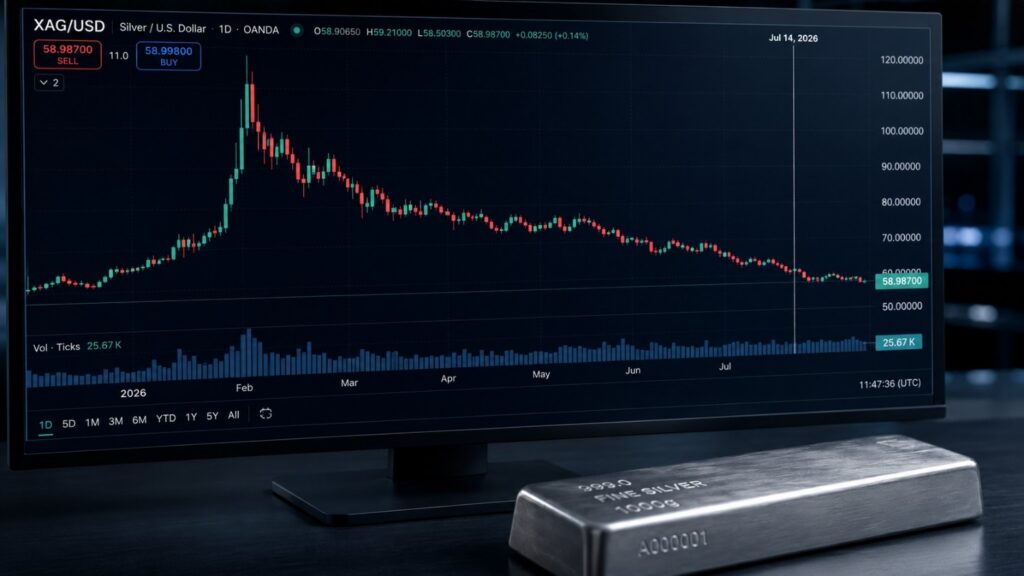
Silver trades at $58.55 — down 52% from its January all-time high, yet the supply deficit is widening, the gold-silver ratio sits at 69:1, and institutional forecasts remain well above current prices. Here is what June CPI and the July 28–29 FOMC meeting mean for silver right now.
Warsh Testified. Gold Jumped $90. The Signal Everybody Missed Was in His Report.
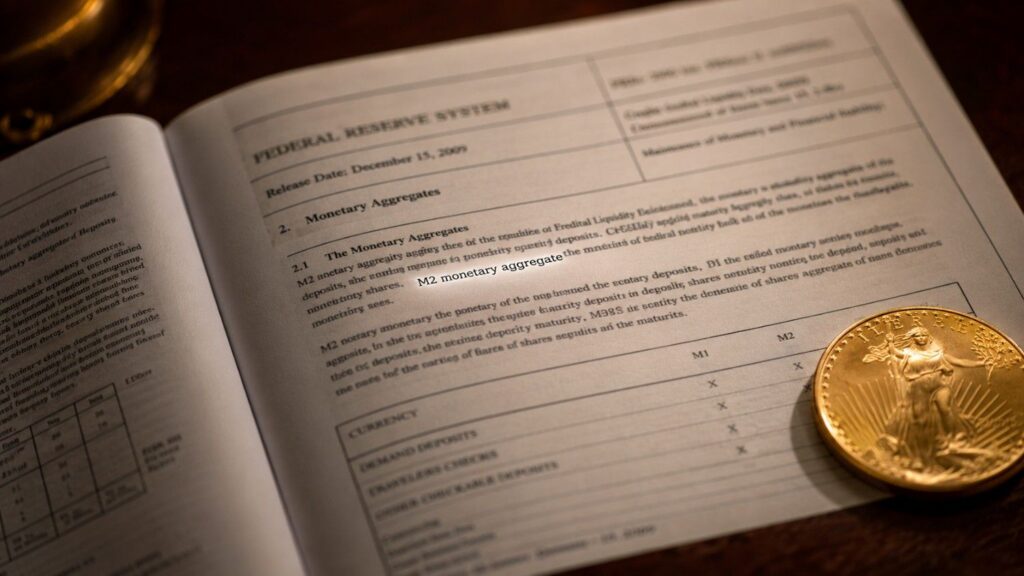
Gold jumped $90 this morning after June CPI printed its biggest monthly drop since April 2020. But the more important signal came from a 57-page document almost nobody read — and it has direct implications for long-term gold holders.
Gold Jumped $90 This Morning. June CPI Just Explained Why.
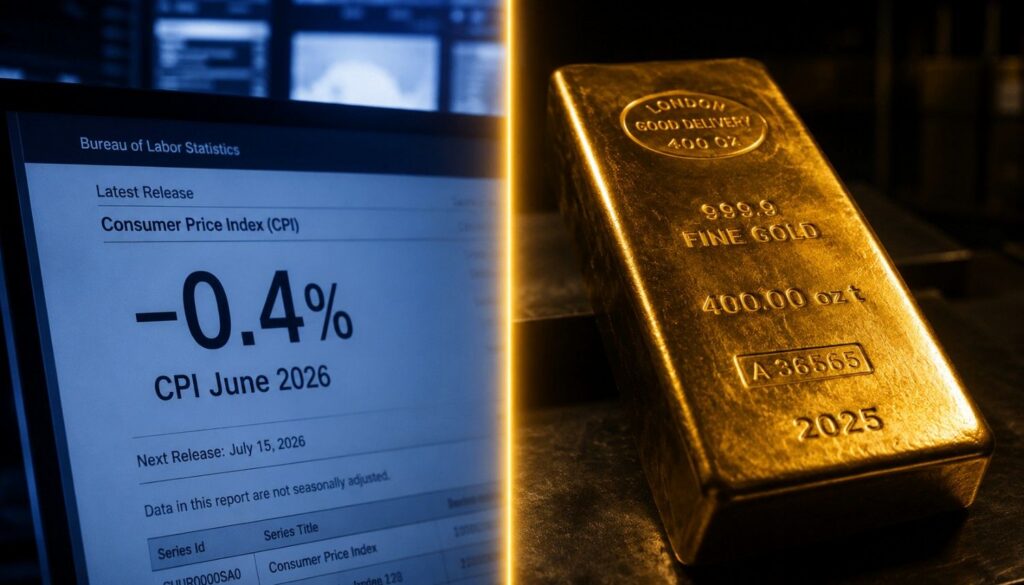
Gold jumped $90 and silver rose 3% after June CPI printed −0.4% — its largest monthly drop since April 2020. Here’s the real-yield mechanism behind the move, and why the headline relief is already reversing.
Silver Fell 3.8% Today. Gold Fell 2.9%. The Gap Has a Name.
Silver fell 3.8% on July 13 while gold dropped 2.9%. The gap is not random. Here is the dual-engine mechanism that explains why silver consistently moves harder than gold — and what two catalysts arriving in the next 18 hours will determine next.
Five Days From Now, Two Numbers Will Decide Gold’s Second Half
Gold is trading at $4,134 today as two market-moving events converge on Monday, July 14. June CPI drops at 8:30 AM ET. Fed Chair Warsh testifies 90 minutes later. Here’s the exact mechanism connecting both to gold and silver prices — and three scenarios for what happens next.
Why Does Silver Drop Before Options Expiration? The Monthly Pattern David Morgan Calls “Courtroom-Level Proof”

Silver drops near options expiration every month — not because of fundamentals, but because of a paper-market mechanism called delta hedging. David Morgan explains how it works, why it’s recurring, and why the structural case for silver remains completely intact.
