Published: 06-04-2026, 01:15 pm
KEY TAKEAWAYS
- April JOLTS data showed 7.62 million job openings — beating the 6.88 million consensus by nearly 750,000
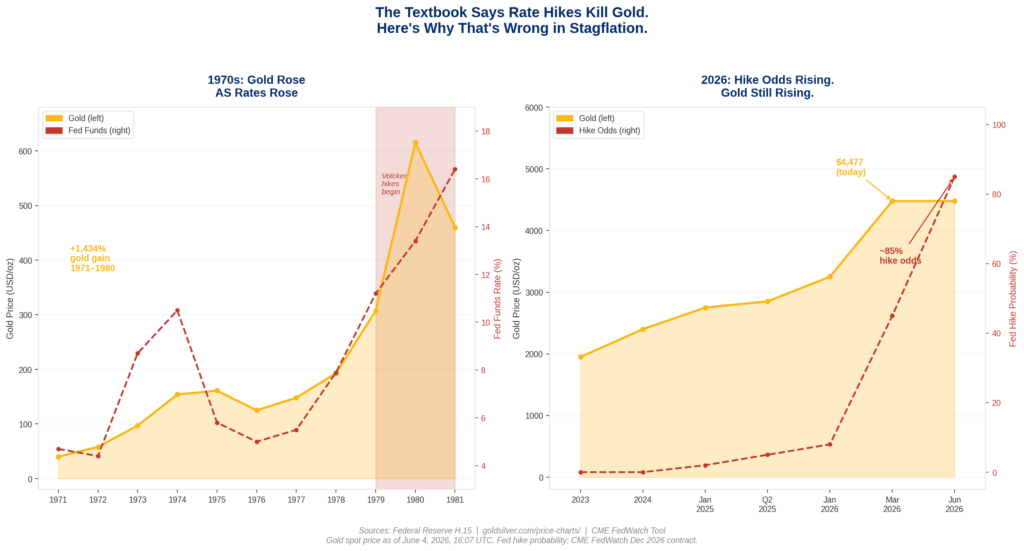
- Gold is up roughly $43 today to $4,477/oz, contrary to the textbook rate-hike reaction
- Fed rate hike odds for December 2026 have climbed to 85% on the CME FedWatch Tool — up from 60% one week ago
- The mechanism: in stagflationary environments, rising rates signal policy failure — which is bullish for gold, not bearish
- The 1970s precedent holds — gold rose from roughly $40 to $850 as the Fed raised rates from 4.7% to nearly 20%
- Volcker ended the bull market only by pushing real rates above +4% — something today’s debt math makes nearly impossible
- Monthly jobs data cuts both ways — but under the real yield mechanism, both strong and weak prints support the structural gold thesis
Why Is Gold Rising When Rate Hike Odds Are This High?
This morning, April job openings came in at 7.62 million. Economists had penciled in 6.88 million. The miss was by nearly 750,000 jobs. Combined with this week’s ADP private payrolls data, the labor market message is clear: the economy is not falling off a cliff.
Under normal circumstances, that reading should hurt gold.
Strong labor market → Fed has room to hike → rates rise → dollar strengthens → non-yielding gold becomes less attractive. Every finance student learns this chain. Most financial headlines repeat it reflexively.
Except gold is up $43 today — about 1% — sitting at $4,477 per ounce as of this afternoon. (World Gold Council; nFusion Solutions, June 4, 2026.)
Meanwhile, the Fed rate hike probability for December 2026 has climbed to 85% on the CME FedWatch Tool — up from 60% just one week ago. (Trading Economics, June 4, 2026.) Markets have fully priced out any rate cuts for the year. Traders are now treating a hike before year-end as the base case, not a tail risk.
Under normal conditions, strong jobs plus rising hike odds would move gold lower. They haven’t. Understanding exactly why requires flipping the standard model upside down.
The Knowledge That Changes Everything
Two essential guides — yours free. Understand why gold matters and why fiat currencies always fail.
Why Does Gold Rise When Rate Hike Odds Rise?
The gold-versus-rates relationship is not wrong. It is incomplete.
Here’s what the standard model gets right. When central banks raise rates in a healthy economy — where inflation is the problem and growth is fine — the opportunity cost of holding gold increases. Bonds start yielding more. The dollar strengthens. Capital flows toward gold have somewhere else to go. Gold falls.
This played out from roughly 2022 to early 2024. The Fed hiked eleven times in sixteen months. Real yields — the return on Treasury bonds after subtracting inflation — moved from deeply negative to clearly positive. Gold struggled for extended periods during that cycle.
Here’s what the standard model misses. The relationship between rates and gold actually runs through real yields, not nominal ones. In a stagflationary environment, rising nominal rates do not automatically translate into rising real yields. That’s because inflation is rising at the same time — or faster.
Real yield = Nominal yield minus Inflation
When headline PCE inflation is running at 3.8% (Bureau of Economic Analysis, April 2026 release, May 28, 2026) and the 10-year Treasury is yielding around 4.3–4.6%, real yields are barely positive. Raising the nominal rate by 25 basis points does not change that math meaningfully. If inflation stays elevated, the saver is still losing or barely preserving purchasing power in real terms.
Gold, which pays no nominal yield at all, is still competitive in real terms against bonds. That’s the mechanism the headlines are not explaining. The number that matters for gold is not the fed funds rate. It is the real yield.
Did Gold Actually Rise During Rate Hikes in the 1970s?
The historical precedent is not subtle.
Between 1971 and 1980, the Federal Reserve raised the federal funds rate from roughly 4.7% to nearly 20%. Conventional wisdom would predict that gold would have fallen as rates climbed. Instead, gold rose from roughly $40 per ounce — when President Nixon ended the dollar’s gold convertibility in August 1971 — to $615 per ounce by the end of 1980. At its January 1980 peak, gold touched $850. That is a gain of more than 1,400% over nine years. During most of that period, the Fed was actively raising rates.
Why? Because in a stagflationary environment, rising rates do not signal that the Fed is winning. They signal that inflation is already so entrenched that the central bank is scrambling to catch up. Investors holding gold were not watching the fed funds rate. They were watching real yields, inflation expectations, and whether the Fed actually had the tools — and the political will — to crush inflation.
Paul Volcker matters precisely because he is the exception that proves the rule.
When Volcker became Fed Chair in 1979, he did not simply raise rates. He pushed the federal funds rate to nearly 20% by 1981 — accepting a deep recession as the necessary cost of killing inflation. Unemployment peaked at 10.8%. The political cost was enormous. He pushed real rates decisively into positive territory. That — and only that — ended the gold bull market. (Federal Reserve Historical Data; Bureau of Labor Statistics.)
The Fed in 2026 is not Volcker.
Why Can’t the Fed Run the Volcker Playbook Today?
The current federal funds rate sits at 3.50–3.75%. Markets are now pricing an 85% chance of one additional 25 basis point hike by December. Let’s take that seriously and ask: what would a hike actually do to real yields?
With headline PCE at 3.8%, a single quarter-point hike barely moves the needle. The 10-year nominal Treasury yield is currently running around 4.48–4.49%. (Trading Economics / U.S. Treasury, June 3–4, 2026.) Against 3.8% headline inflation, that implies a real yield of roughly +0.6–0.7%. The 10-year TIPS yield — the market’s direct measure of real rates — was running at approximately 1.96–1.99% as of early April 2026. (Trading Economics, TIPS daily data.) That is positive. But it is far from the +4 to +6% real yields that Volcker achieved when he broke inflation expectations.
More critically, US federal debt is now approaching $39 trillion. (Joint Economic Committee, March 2026.) The government is currently spending over $1 trillion per year on interest payments alone. (Congressional Budget Office, FY2026 projections.) A Volcker-style rate path — pushing rates to 15–20% — would add trillions more in annual interest expense. Consequently, it would risk triggering a sovereign debt spiral that would make the gold case not weaker, but dramatically stronger.
The Fed is caught between two bad options. It cannot hike aggressively enough to crush inflation without breaking the fiscal math. So every quarter that inflation runs above the real yield on savings accounts, physical gold owners are watching their purchasing power preserved while bond holders watch theirs erode.
This is not a fringe thesis. TD Securities commodities strategist Bart Melek noted this week that higher inflation expectations from energy supply shocks have “pushed yields across the curve higher, kept the USD firm, and prompted markets to begin pricing in a Fed hike in late 2026.” (TD Securities, June 3, 2026.) Notably, his bank simultaneously cut its near-term gold forecast while maintaining a long-term target well above $5,000/oz — because both observations can be simultaneously true in a stagflationary environment.
What Does “Trapped” Mean for Physical Gold Owners?
Here is the plain version.
In a normal cycle, the Fed raises rates to cool a hot economy. Higher rates slow borrowing, reduce spending, cool inflation, and eventually let the central bank declare victory. In that environment, gold faces two headwinds: rising real yields and a strengthening dollar. The gold trade works best when the Fed is cutting, not hiking.
In a stagflationary cycle, the economy is already slowing or stagnant — and inflation remains elevated. The Fed is raising rates not to cool an overheating economy, but to maintain credibility while the underlying problem (energy prices, supply constraints, fiscal deficits) remains unresolved. Therefore, rising rates in this environment do not fix the problem. They just demonstrate that the central bank is trying.
What happened during the stagflation of the 1970s is now well-documented. The S&P 500 delivered close to zero real return across that decade as a whole. Bonds faced a structural problem — fixed coupon payments becoming worth less every year that inflation ran above the yield. Gold, by contrast, had no coupon to erode.
The 2026 version of this dynamic has one additional layer the 1970s did not: central banks are buying gold themselves. The World Gold Council confirmed 244 tonnes of net central bank purchases in Q1 2026 alone — continuing seventeen consecutive quarters of net purchases. (World Gold Council Gold Demand Trends Q1 2026, published April 29, 2026.) Central banks raising rates while simultaneously accumulating gold are not contradicting themselves. They are hedging their own creation.
Why Does the Monthly Jobs Report Cut Both Ways for Gold?
The monthly nonfarm payrolls report illustrates exactly why the real yield mechanism matters more than any single data point. The April 2026 print — 115,000 jobs added, well above the 62,000 consensus — is a useful case study.
Under the standard model, a strong jobs number should hurt gold. Strong labor market gives the Fed room to hike, hike odds rise, gold falls. That is the reflex trade. But under the real yield mechanism, the reaction is more nuanced.
When jobs data is strong: Markets price a Fed hike more aggressively. The dollar firms. Gold may see short-term pressure. But a 25 basis point hike against 3.8% headline inflation does not create meaningfully positive real yields. The structural floor holds. Historical dips on strong jobs data have consistently been used by informed physical gold buyers to add to positions — because the mechanism hasn’t changed.
When jobs data is weak: The stagflation picture sharpens. Slow growth plus persistent inflation plus a Fed that cannot hike aggressively equals the textbook definition of the environment where gold outperforms. Even April’s strong beat failed to dent gold’s structural floor — because the market understood the mechanism.
This is the more durable lesson. Monthly employment releases move gold for a few hours. The real yield dynamic described throughout this article has been driving gold’s structural direction for several years. The monthly data point is noise. The mechanism is the signal.
What Would Actually Break the Gold Thesis?
There is one scenario where this analysis becomes wrong.
If a future Fed Chair achieves what Volcker achieved — driving real yields decisively above +4% and holding them there long enough to break inflation expectations — the stagflationary environment for gold ends. That is the lesson from 1981. It is not a mystery.
But achieving that today would require pushing the fed funds rate to roughly 8–9% while inflation runs near 4%. At approaching-$39-trillion in national debt, the annual interest cost would approach $3 trillion. The political economy of that path is nearly impossible. The fiscal math makes it extraordinarily unlikely.
Until real rates turn decisively positive — and stay there — the mechanism driving gold higher since 2022 remains intact. The textbook is not wrong. It is just describing a different economic environment than the one we are actually in.
That is not a reason to panic. That is the definition of understanding the system you are already living in.
Stay On Top of Gold & Silver Prices
Get important market alerts sent straight to your inbox.
SOURCES
1. GoldSilver — Gold & Silver Price Charts
2. Bureau of Economic Analysis — Personal Consumption Expenditures Price Index, April 2026
3. Bureau of Labor Statistics — Job Openings and Labor Turnover Summary, April 2026
4. World Gold Council — Gold Demand Trends Q1 2026
5. Peter G. Peterson Foundation — Interest Costs on the National Debt
6. CME Group — FedWatch Tool
7. FXStreet — TD Securities / Bart Melek Commentary, June 3, 2026
Disclaimer: This article is for informational purposes only and does not constitute financial or investment advice. Always consult a qualified financial adviser before making investment decisions.
You may also like:
- Gold Confiscation: Could the Government Take Your Gold Again?
- Gold Price History: From $35 to $4,500 in 100 Years
- The Debasement Trade Explained: Mechanism, History, and What It Means for Gold
- Gold or Silver First? A First-Time Buyer’s Framework
- Gold Reserves by Country: The 2026 Rankings
- Gold Portfolio Allocation: Why Wall Street Is Rewriting the 60/40
- What Does the SILVER Act Mean for Precious Metals Investors?
- What Backs the US Dollar? Not Gold. Not Silver.
- Why Is Gold Valuable? The 5,000-Year Answer Most Investors Get Wrong
- 72% of Family Offices Hold No Gold. What They’re Missing.