Published: 06-15-2026, 08:50 am
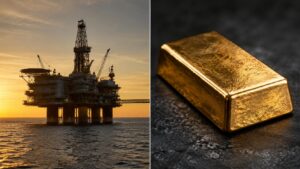
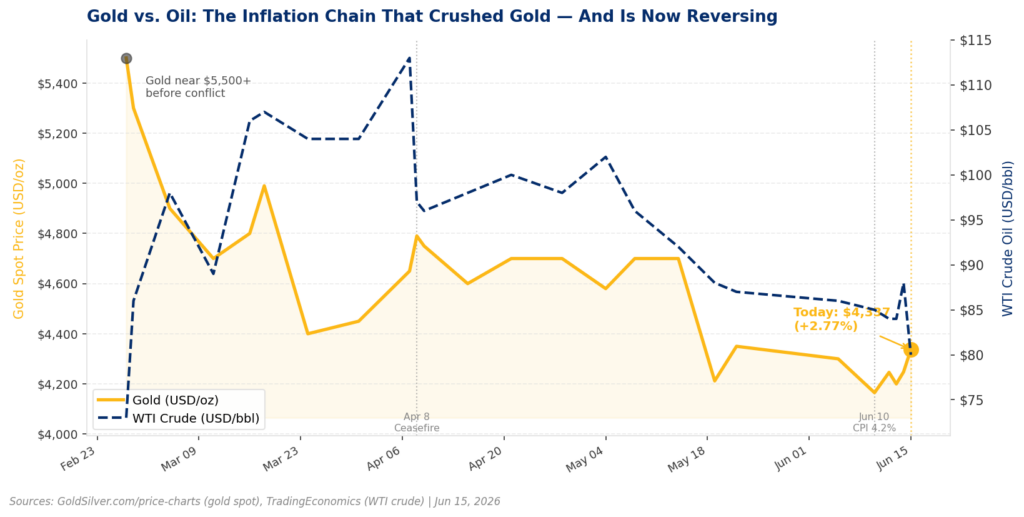
On Sunday night, Pakistan’s Prime Minister announced that the United States and Iran had reached a peace deal. It will end nearly four months of war. The formal signing is set for Friday in Switzerland. Oil markets opened Monday and sold off hard. WTI crude fell more than 5% to around $80 a barrel — a two-month low (TradingEconomics, June 15, 2026).
Gold went up.
Not down. Not sideways. Spot gold rose roughly 2.7% to above $4,300 an ounce (GoldSilver.com/price-charts, June 15, 2026). Silver gained nearly 4% to above $70.50. Both metals climbed on the same news that sent oil plunging.
Most coverage today is calling this a safe-haven trade — the idea that gold rises when the world feels uncertain. But that explanation doesn’t hold up. After all, the peace deal is supposed to remove uncertainty. And gold rose anyway.
Here’s the actual mechanism.
Why Did the Iran War Hurt Gold Prices?
This sounds counterintuitive. However, the Iran conflict turned out to be one of the worst things that happened to gold in years. It began on February 28, when US and Israeli forces launched strikes on Iranian nuclear facilities.
Here’s why. When Iran closed the Strait of Hormuz, about 20% of global seaborne oil trade stopped moving. As a result, energy prices surged. Brent crude climbed from roughly $70 a barrel to above $114 by mid-March (TradingEconomics, March 2026). That was the largest single-month oil gain since records began in 1988. That energy spike fed directly into consumer prices. By May, US inflation had climbed to 4.2% year over year — the hottest reading since April 2023 (Bureau of Labor Statistics, June 10, 2026). Energy costs drove more than 60% of that monthly gain.
High inflation, normally, is good for gold. But this inflation came with a catch. It forced the Federal Reserve to consider raising interest rates. When rates go up, newly issued US Treasury bonds become more attractive because they pay more yield. Gold pays no yield at all. So investors sold gold to buy bonds.
That’s the chain: Hormuz closure → oil spike → inflation surge → rate-hike fears → bond yields up → gold down. Gold hit its all-time high of $5,589 on January 28, 2026 (GoldSilver.com). By June 10, it had fallen roughly 25% to lows near $4,165 (Bureau of Labor Statistics). In short, the war didn’t protect gold. It trapped it.
Why Is the Peace Deal Pushing Gold Higher?
The chain works in reverse now. The peace agreement — if it holds — reopens the Strait of Hormuz and restores Gulf oil flows. It also removes the supply disruption that drove energy prices higher in the first place. Oil fell more than 5% today, pricing in exactly that (TradingEconomics, OilPrice.com, June 15, 2026). Lower oil means lower energy inflation. Lower energy inflation, in turn, means the Federal Reserve’s case for raising rates this year weakens. As the rate-hike thesis fades, the pressure on gold fades with it.
This is why gold is up on peace news. It is rising because of what peace does to the inflation-and-rates chain. That chain suppressed gold for nearly four months.
Markets have now scaled back the probability of a December rate hike to around 53% (CME FedWatch Tool, via CNBC, June 15, 2026). Before the deal, that figure stood at 69%. That is a significant shift. Gold is acutely sensitive to interest rate expectations. A 16-point drop in hike odds matters a great deal.
The Edge Every Investor Needs Smarter precious metals investing starts here. The Nuggets Newsletter brings you essential market insights, Fed updates, global trends, educational videos, and much more.
What Does the Fed Decision Mean for Gold This Week?
The Federal Reserve opens its June 16–17 policy meeting tomorrow. It is the first meeting chaired by Kevin Warsh, who was sworn in as Fed Chair on May 22. The rate decision itself is essentially settled — markets are pricing a 97% probability of no change (CME FedWatch Tool, June 9, 2026).
What is not settled is where rates are heading. Warsh’s tone at his inaugural press conference is the key to watch. Analysts at Vital Knowledge said Warsh “could put his thumb on the scale during the press conference and tip things in a dovish direction” (Investing.com, June 15, 2026). The reasoning is straightforward. A peace deal reduces energy inflation. That weakens the case for holding rates elevated.
Therefore, if Warsh signals that Hormuz resolution makes rate hikes less likely, the mechanism that crushed gold continues to unwind. Six weeks of rate uncertainty resolves by Wednesday evening.
Meanwhile, central banks are still buying. The World Gold Council reported 244 tonnes of net central bank purchases in Q1 2026. Another 17 tonnes followed in April (World Gold Council, June 3, 2026). China has added to its gold reserves for 18 consecutive months. The institutional buyers who drove gold to $5,589 in January didn’t stop when the conflict began. They used the pullback.
What Does the Iran Peace Deal Mean for Long-Term Gold Holders?
For long-term holders of physical gold and silver, today is a reminder worth sitting with. Gold doesn’t always behave the way headlines suggest it should.
The Iran war was supposed to be bullish for gold. It wasn’t — because of the monetary chain running beneath the geopolitical headline. Similarly, the peace deal is supposed to be bearish for gold. It isn’t — because that same chain is now running in reverse.
Understanding the mechanism is more valuable than knowing the headline. The specific path runs from oil prices to inflation to interest rates to gold. It is, ultimately, what separates investors who react from investors who understand.
The structural case for physical gold and silver hasn’t changed. Government spending continues to run above tax revenue. The Federal Reserve remains constrained by inflation on one side and political pressure on the other. Furthermore, every major institutional forecast still sits well above current prices. Goldman Sachs, JPMorgan, and Morgan Stanley all project levels well above $4,300 (Goldman Sachs, JPMorgan research, 2026). Today’s peace deal doesn’t change the long-term thesis. It removes a short-term headwind.
That’s not complicated. That’s just how money works.
Stay On Top of Gold & Silver Prices
Get important market alerts sent straight to your inbox.
SOURCES
1. TradingEconomics — Crude Oil Price, June 15, 2026
2. TradingEconomics — Brent Crude Oil Historical Data, March 2026
3. OilPrice.com — Oil Prices Plunge as US and Iran Reach Deal to Reopen Strait of Hormuz
4. Bureau of Labor Statistics — Consumer Price Index, May 2026
5. CNBC — Gold Gains Over 1% After US, Iran Reach Peace Deal
6. CME Group — FedWatch Tool, June 9, 2026
7. Investing.com — US, Iran Reach Interim Peace Deal; Oil Drops; Gold Gains
8. World Gold Council — Gold Demand Trends Q1 2026: Central Banks
9. World Gold Council — Central Bank Gold Statistics: Central Banks Resume Net Buying in April
10. GoldSilver.com — Live Gold and Silver Price Charts
Disclaimer: This article is for informational purposes only and does not constitute financial or investment advice. Always consult a qualified financial adviser before making investment decisions.
You May Also Like:
- Gold & Silver Surge on Iran Peace Deal — Then Pull Back
- Silver Fell 22% in 30 Days. Gold-Silver Ratio Hits 63.
- Every Bearish Catalyst Landed at Once. Gold and Silver Went Up Anyway.
- Gold at Seven-Month Lows: Why Geopolitical Fear Is Not Enough
- Gold Slides to $4,130 as Iran War Turns Inflation Against It
- May CPI Printed 4.2%. Core Inflation Beat. So Why Did the Gold Price Drop?
- Gold Is Down 9%. The CPI Print That Could Either Extend the Drop — or End It.
- Gold Price News: Goldman, China, CPI, and the Fed Explained
- Gold Near $4,330 as Rate-Hike Bets Hit 70% and China Acts
- Gold Is Down 22% — The Same Drop as 2022. The Floor Is Not the Same.
- Silver Falls 6% on Jobs Beat. The Six-Year Deficit Didn’t.