Silver Rises Over 120% YTD




Published: 07-06-2026, 05:08 pm
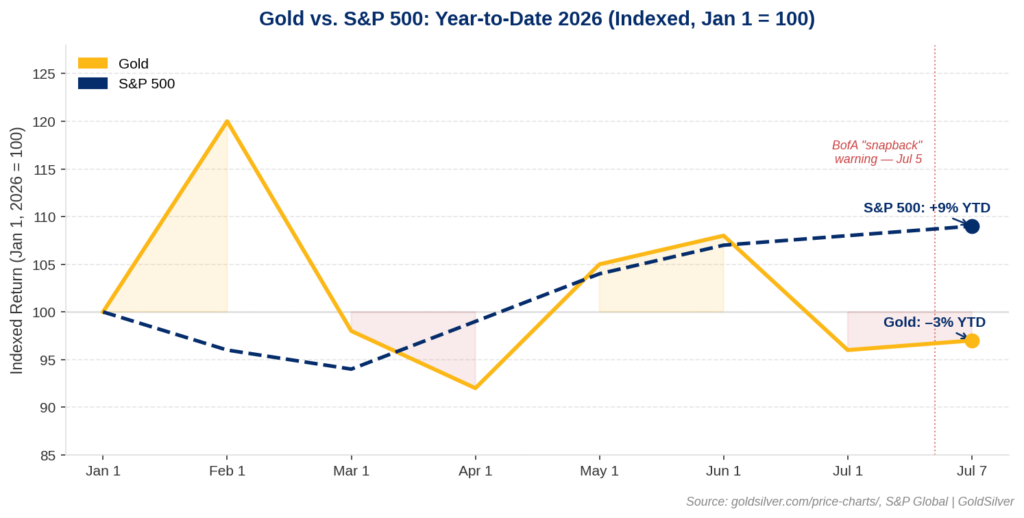
Bank of America placed current U.S. equity speculation at its most extreme level since 1999 to 2000 — the year before gold began its longest bull run in modern history. Gold is trading near $4,160 as of July 6, 2026 [EDITOR: verify current price], down about 3% year-to-date. The S&P 500 is up 9%. That gap is not a riddle. It is the setup.
What BofA Said
On July 5, 2026, Bank of America’s Savita Subramanian reaffirmed her year-end S&P 500 target: 7,100, roughly 5% below current levels. The language in the note was specific: “Our bear market signposts suggest speculation is hitting extreme levels as high multiple stocks have gapped up demonstrably, an event that has historically preceded a valuation ‘snapback.'”
This is not a fringe call. The same bank spent the first half of 2026 warning the S&P was priced beyond earnings. They also noted no rate hike cycle since 1999 to 2000 has started with stocks this expensive. That is a precise historical comparison, not vague alarm.
The AI boom has driven the concentration. Micron Technology is up 242% this year. SK Hynix lists on Nasdaq July 10, targeting $29 billion — the largest U.S. offering by a foreign company in history. Capital has crowded into a narrow band of high-multiple technology names. BofA’s view: that concentration does not expand further. It corrects.
The 1999 Parallel Gold Investors Should Know
Here is where that comparison leads.
Gold hit its 20-year low in August 1999 at $252 — at the height of dot-com mania. Central banks were selling. Tech stocks were returning 40% a year. The Financial Times ran a headline calling gold a dead relic. Consensus was unanimous: who needs sound money when the Nasdaq delivers?
The Nasdaq peaked in March 2000. Tech stocks began their unwind. Gold was already building a base near its generational low. It began a climb that ran for more than a decade. From roughly $254 in 2001, gold reached $1,921 in September 2011. Per World Gold Council data, that is a 659% gain — through two recessions, a financial crisis, and years of zero-interest-rate policy.
The mechanism is straightforward. When earnings-driven assets compressed, capital moved to assets that require no earnings at all. Gold does not have a price-to-earnings ratio. It does not need AI to justify its existence. It simply stores purchasing power outside the financial system.
That mechanism has not been repealed.

The Edge Every Investor Needs Smarter precious metals investing starts here. The Nuggets Newsletter brings you essential market insights, Fed updates, global trends, educational videos, and much more.
Why Gold Is Down While Stocks Are Up
The disconnect in 2026 has a clean explanation. Gold’s primary headwind has been real yields. When nominal rates rise faster than inflation expectations, non-yielding assets face pressure. The Federal Reserve held rates at 3.50–3.75% in June. Nine of eighteen participating members projected a 2026 rate hike, per the June 2026 Summary of Economic Projections. Gold fell approximately 12% in June — its worst monthly decline since October 2008.
Gold has since recovered. The week ending July 3 was its first weekly gain since late May, up 2.3%. The Bureau of Labor Statistics reported just 57,000 June payrolls — well below the 110,000 forecast. Per CME FedWatch, the September rate hike probability fell from 66% to roughly 50% on the print.
Silver [EDITOR: verify ~$62] gained 6.7% in the same week versus gold’s 2.3%. The gold-to-silver ratio compressed from above 72 in late June to around 67 as of July 6, 2026. A silver-over-gold move of that magnitude typically signals industrial buyers getting ahead of expected easing — constructive for physical metal holders.
Gold is not down because the structural case has changed. It is down because the Fed’s hawkish pivot created real-yield headwinds. Speculative capital has been chasing AI returns rather than physical metal. That is different from the structural case being broken.
What the Sound Money Lens Shows
Five major institutions — State Street, Goldman Sachs, the World Gold Council, UBS, and MKS PAMP — published fresh gold analysis in early July 2026. All five concluded the same thing: the Q2 selloff changed the entry price, not the structural thesis.
The structural forces have not changed. The U.S. government is running fiscal deficits. The national debt keeps growing. The Federal Reserve is caught between fighting inflation and avoiding a recession. None of those forces have resolved. They have been temporarily overshadowed by AI enthusiasm.
When equity speculation reaches the extreme BofA is benchmarking against 1999, gold’s cost relative to stocks falls toward its lowest point. Gold has not participated in the AI boom. That makes it the cheapest it has been relative to equities in years. Insurance is always cheapest when no one believes they need it.
The FOMC minutes from the June 16–17 meeting drop this Wednesday, July 8, at 2:00 p.m. ET. Nine of eighteen committee members projected a 2026 rate hike. The minutes will show how serious that faction is. A hawkish reading pushes September hike odds back toward 60% and adds near-term pressure on gold. A dovish lean could open the path toward $4,200 and beyond.
The question BofA raised is worth sitting with. In 1999, U.S. equities were this expensive. Gold was at a 20-year low. What followed is on the record.
History answered that question once. Gold went from $252 to $1,921. The circumstances are different today. The mechanism is the same.
Stay On Top of Gold & Silver Prices
Get important market alerts sent straight to your inbox.
SOURCES
1. Fortune — BofA Stock Market Warning, Speculation Hitting Extreme Levels, July 5, 2026
2. CNBC — Gold Prices Set for First Weekly Rise in a Month as Fed Rate Hike Bets Recede, July 3, 2026
3. GoldSilver — Live Gold and Silver Spot Prices, July 6, 2026
4. Federal Reserve — FOMC Meeting Calendar and June 2026 Summary of Economic Projections
5. Bureau of Labor Statistics — Employment Situation Summary, June 2026
6. CME Group — FedWatch Tool, September 2026 Rate Probability, July 6, 2026
7. Trading Economics — Gold Price Historical Data, July 2026
8. CNBC — Gold Faces Biggest Monthly Drop Since Late 2008 on Hawkish Fed Stance, June 30, 2026
Disclaimer: This article is for informational purposes only and does not constitute financial or investment advice. Always consult a qualified financial adviser before making investment decisions.
You May Also Like:
- Warsh Sat Out the Dot Plot. The FOMC Minutes Drop Wednesday.
- Gold Digest: Five Institutions Just Said the Same Thing About the Selloff
- Gold Hits 3-Week High as Fed Hike Odds Halve on Jobs Miss
- The Jobs Report Missed. The Unemployment Rate Fell Anyway. Gold Didn’t Buy It.
- Gold Jumps 2.5%, Silver Surges 3.85% as Rate-Hike Bets Unwind Ahead of Jobs Report
- Warsh Called Inflation “Too High.” He Also Said the Risk Is Fading. Gold Noticed.
- ADP Missed. Gold Shrugged. Warsh Is Live in Sintra Right Now.