Published: 07-03-2026, 09:43 am
Key Takeaways
- June nonfarm payrolls rose just 57,000, less than half the 115,000 Dow Jones consensus, with April and May revised down by a combined 74,000 jobs.
- CME FedWatch odds of a Fed hold at the July 29 FOMC meeting rose from about 70% to about 78% after the report, cutting implied hike odds to roughly 22%.
- Gold is at $4,174.42 (+1.23%) and silver at $62.22 (+1.97%) as of July 3, 2026, on pace for their first weekly gain since late May.
- Lower hike odds compress expected real yields, which reduces the opportunity cost of holding gold. This is the direct transmission mechanism between a soft jobs print and a bullion bid.
- Key upcoming dates: June CPI (July 14), FOMC decision (July 29), and June PCE (July 30).
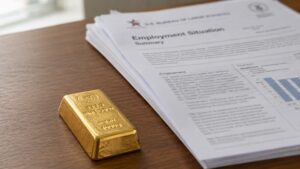
Gold hit a 3-week high on July 3, 2026, after June’s nonfarm payrolls came in at 57,000, less than half the 115,000 forecast. That miss cut fed rate hike odds for the July 29 FOMC meeting from about 30% to about 22%. Fifteen days after the Federal Reserve’s rate-setting committee turned sharply hawkish, one jobs report reversed most of that shift.
Gold is trading at $4,174.42 today, up 1.23%, and silver is at $62.22, up 1.97% (goldsilver.com/price-charts/, July 3, 2026). Both metals are on pace for their first weekly gain since late May.
Source: goldsilver.com/price-charts/ | GoldSilver.com
Why Did the Jobs Report Move Gold Prices?
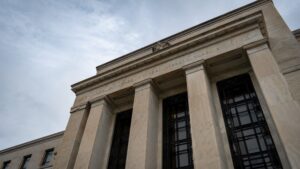
The Fed held its benchmark rate at 3.50% to 3.75% on June 17, Federal Reserve Chair Kevin Warsh's first meeting at the helm. However, the committee's dot plot turned hawkish enough that markets spent two weeks pricing in real odds of a hike at the next meeting, July 29. Eighteen participants submitted projections that day. Notably, Warsh withheld his own.
Then Thursday's numbers landed. The Bureau of Labor Statistics reported nonfarm payrolls rose by just 57,000 in June, well short of the 115,000 Dow Jones consensus. April and May were revised down by a combined 74,000 jobs: April cut to 148,000 from 179,000, May to 129,000 from 172,000. The unemployment rate fell to 4.2% from 4.3%, but not because more people found work. Instead, the labor force participation rate dropped to 61.5%, the lowest since March 2021. The household survey showed 507,000 fewer people employed than the month before.
That combination of a soft headline print, large downward revisions, and a shrinking labor force is exactly what moves fed rate hike odds.

The Edge Every Investor Needs Smarter precious metals investing starts here. The Nuggets Newsletter brings you essential market insights, Fed updates, global trends, educational videos, and much more.
What Happened to Fed Rate Hike Odds After the Report?
The shift in fed rate hike odds was sharp. As recently as June 29, the CME Group's FedWatch tool showed about 70% odds of a hold at the July 29 meeting, leaving a real probability of a hike on the table. Once Thursday's report landed, hold probability rose to about 78% and implied hike odds fell to about 22%. September odds also moved, sliding from around 64% to the low 50s.
Consequently, the dollar index dropped to about 100.8 from 101.4, on pace for its first weekly decline in three weeks. When a jobs report misses by 58,000 and carries a 74,000-job downward revision, traders price in a more patient Fed. A more patient Fed means lower expected real yields, and lower real yields reduce the opportunity cost of holding gold. That is the direct transmission mechanism between a soft payrolls print and a bid in bullion.
Jefferies senior economist Thomas Simons said the report gives the Fed no reason to act near term. Job growth is solid enough to hold unemployment steady without the wage pressure that would force the committee's hand. Warsh himself, speaking a day earlier at the ECB's Sintra forum, called a July decision a "family fight" still four weeks away. He also noted the Fed's preferred trimmed-mean inflation gauge has fallen year-over-year for 36 straight months.
What Does This Mean for the Structural Case for Gold and Silver?
That 36-month streak is worth sitting with. The Fed's own preferred gauge has run above its 2% target for three years. Yet the same committee that turned hawkish two weeks ago is now being told by the labor market that it cannot safely tighten. Too much inflation to cut. Too much labor weakness to hike. Gold and silver sit outside that argument entirely.
Whichever way the Fed resolves it, the purchasing power case for holding physical metal does not depend on the committee getting the call right. The structural floor under both metals does not reprice on a single Friday morning. The People's Bank of China (PBoC) has added to gold reserves for 19 consecutive months, and the Silver Institute projects a sixth straight annual silver supply deficit. Those forces were in place before this week's print, and they remain after it.
The real story is not the jobs number itself. It is how fast fed rate hike odds swung on one data point. Hold probability at July 29 moved from about 70% just days earlier to about 78% once the report landed. Crucially, that shift came on a print carrying a 74,000-job downward revision to figures released weeks earlier. Physical gold and silver carry no revision risk. Their price reflects what is happening now, not a household survey that will be restated in August.
What Should Gold Investors Watch Before July 29?
Three dates matter more than today's print. July 14 brings the June CPI release. A cooler print keeps fed rate hike odds subdued; a hot one puts them back on the table.
July 29 brings the FOMC decision: statement at 2:00 p.m. ET, Warsh's press conference at 2:30 p.m. Because July carries no dot plot, the statement language carries extra weight. June PCE follows on July 30. Tradu.com senior analyst Nikos Tzabouras flagged $4,250 as the near-term resistance level to watch on gold.
Stay On Top of Gold & Silver Prices
Get important market alerts sent straight to your inbox.
SOURCES
1. Bureau of Labor Statistics — Employment Situation, June 2026
2. CME Group — FedWatch Tool
3. Federal Reserve — FOMC Statement and Summary of Economic Projections, June 17, 2026
4. CNBC — U.S. job creation cools in June with payrolls growth of just 57,000
5. Benzinga — U.S. June Jobs Report Review
6. USAGOLD — Daily Precious Metals Market Report, July 2, 2026
7. GoldSilver.com — Live Gold and Silver Price Charts
Disclaimer: This article is for informational purposes only and does not constitute financial or investment advice. Always consult a qualified financial adviser before making investment decisions.
You May Also Like:
- The Jobs Report Missed. The Unemployment Rate Fell Anyway. Gold Didn’t Buy It.
- Gold Jumps 2.5%, Silver Surges 3.85% as Rate-Hike Bets Unwind Ahead of Jobs Report
- Warsh Called Inflation “Too High.” He Also Said the Risk Is Fading. Gold Noticed.
- ADP Missed. Gold Shrugged. Warsh Is Live in Sintra Right Now.
- OCBC Just Cut Its Gold Forecast by $740. The Reason Is the Story.
- Gold Is Closing Its Worst Quarter Since 2013. A War Made It Happen.
- 172,000 Jobs Doubled the Forecast. Thursday’s Report Could Move Gold Again.