Silver Rises Over 120% YTD




Published: 09-01-2026, 04:34 pm | Updated: 09-01-2026, 04:53 pm
J.P. Morgan took its fourth-quarter silver forecast from $90 to $63. The cut had little to do with interest rates. It had a great deal to do with solar panels.
Silver trades at $64.44 an ounce as of 2:30 PM ET on Tuesday, September 1, 2026. Gold sits at $4,336.46. So it takes 67.3 ounces of silver to buy one ounce of gold.
Hold that ratio in mind. It does more work here than any price target.
On August 13, 2026, J.P. Morgan Global Research rebuilt its silver forecast. The projected average for the fourth quarter of 2026 fell from $90.00 an ounce to $63.00.
Silver currently trades above that revised figure, by about 2%.
That is unusual. Normally a bank cutting targets is catching up to a market that already moved. We saw exactly that in gold last week. Six banks cut a 2026 gold target between June and late August, and gold still trades below four of the six reduced figures. Those cuts chased the price and never caught it.
Silver is the opposite case. Here the cut caught the price, and the price kept falling.
What changed in J.P. Morgan’s silver forecast?
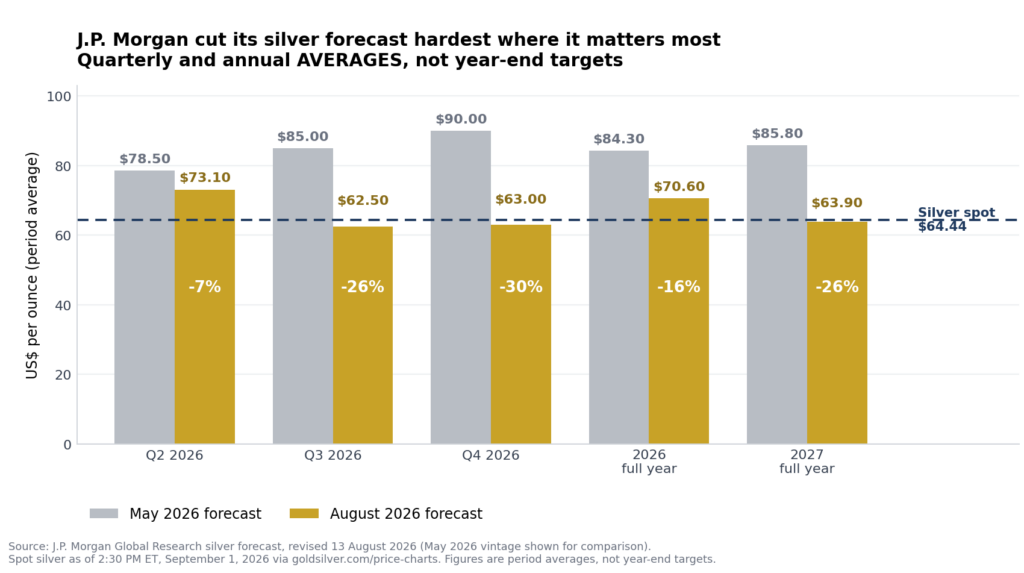
Here is the revision. One house, both vintages, according to J.P. Morgan Global Research’s published table of August 13, 2026.
What changed in J.P. Morgan’s silver forecast?
Here is the revision. One house,both vintages,according to J.P. Morgan Global Research’s published table of August 13,2026.
| Period | May 2026 | August 2026 | Change |
|---|---|---|---|
| Q2 2026 | $78.50 | $73.10 | −7% |
| Q3 2026 | $85.00 | $62.50 | −26% |
| Q4 2026 | $90.00 | $63.00 | −30% |
| 2026 full year | $84.30 | $70.60 | −16% |
| 2027 full year | $85.80 | $63.90 | −26% |
All figures are quarterly and annual averages,not year-end targets. Source:J.P. Morgan Global Research,August 13,2026.
Why does the basis label matter?
That note matters more than it looks. A 2026 average of $70.60 sounds bullish against $64.44 spot. However,silver averaged $83.70 in the first quarter. Most of the year’s average is therefore already banked. The forward-looking number is the Q4 figure of $63.00.
Notice the shape too. The Q2 cut was 7%. Every quarter after it was cut 22% or more. So this is not a bank marking its book to a lower spot price. Instead,it is a bank changing its view of the future while leaving the past alone.
Only one house appears in that table,and that is deliberate. A dozen silver forecasts circulate with bank names attached,$44 here and $309 there. Most trace back to aggregators quoting other aggregators. One widely repeated deficit figure turned out to be a February number that April superseded. Better one revision read in the primary source than a league table we cannot stand behind.
The Knowledge That Changes Everything

Two essential guides — yours free. Understand why gold matters and why fiat currencies always fail.
If not the Fed, what caused the cut?
The easy story is interest rates. It is also incomplete.
Rates do matter. Gregory Shearer, head of Base and Precious Metals Strategy at J.P. Morgan, says so plainly. Higher rates raise the opportunity cost of holding an asset that pays nothing. Capital then rotates into things that do.
That is the mechanism behind the current move. Between the open and 2:30 PM ET on September 1, silver fell 3.17% while gold fell 2.50%. Silver’s larger drop on identical news is not sentiment. Gold has a structural buyer that silver lacks. Central banks accumulate gold as a reserve asset, and they do not accumulate silver. When rates repriced, gold had a bid underneath it.
But rates are not what took 30% out of the Q4 number.
How big is the solar demand decline?
Shearer expects solar demand for silver to fall by around 30% this year. He sizes that at roughly 60 million ounces.
Silver in a solar panel is a paste. It carries the current the cell generates. It is therefore a cost input. When a cost input triples in price, engineers do what engineers do. First they redesign to use less of it. Then they substitute it where they can. The industry calls this thrifting, and Shearer notes it has recently been adopted much more widely.
Two policy shocks accelerated the shift. China front-loaded silver imports ahead of April 1, when an export VAT rebate on photovoltaic products was removed. Chinese buyers have been working that stockpile down since. Meanwhile India, the other large importing market, raised its effective import duty on gold and silver from 6% to 15% on May 13, 2026. Customs notifications set a 10% basic duty plus a 5% cess. CNBC and Reuters both reported the change on May 13, 2026. The stated aim was to ease pressure on the country’s foreign exchange reserves.
Here is the part worth sitting with. Solar installations can keep growing while silver demand from solar falls. Panels per year up, silver per panel down. Both are true at once. Consequently, a headline about record solar deployment tells you nothing about silver demand. You also need to know what happened to the loading.
Is the demand loss bigger than the shortage?
The bull case rests on a structural supply deficit, and that deficit is real. The World Silver Survey 2026, published by the Silver Institute with Metals Focus on April 15, 2026, projects a 46.3 million ounce deficit for 2026. That is the sixth consecutive annual shortfall. It widens 15% from 40.3 million ounces in 2025.
Be precise about when this run started, because a lot of writing gets it wrong. The deficits began in 2021, not 2020. On Silver Institute data, silver ran surpluses from 2016 through 2020. Then 2021 delivered the first deficit, at 75.3 million ounces. Since then, the cumulative drawdown from above-ground stocks is 762.1 million ounces. That is roughly a year of global mine supply, pulled out of vaults to keep the market balanced.
So set the two figures side by side:
- Projected 2026 deficit: 46.3 million ounces
- Shearer’s expected solar demand reduction: roughly 60 million ounces
The demand reduction one analyst forecasts is larger than the entire shortage the bull case is built on.
Can you subtract one number from the other?
No, and this is where overclaiming would be easy.
The Silver Institute’s 46.3 million ounce figure already assumes solar demand falls. Its own language is that ongoing thrifting and substitution away from silver will reduce photovoltaic demand. It also has total industrial demand down about 2% on the year, a four-year low, as Reuters reported in April 2026. Some of the decline therefore sits inside the deficit number already. Furthermore, J.P. Morgan publishes no surplus forecast, so it would be wrong to put one in its mouth.
What the comparison does establish is sharper than a surplus call, and more useful.
These two institutions are not disagreeing about whether solar demand falls. They are disagreeing about how far. That single variable is large enough to decide whether the sixth deficit year happens at all.
That fork is testable. It resolves in Chinese and Indian import data, and in panel loading disclosures. It does not resolve in Fed statements.
What does the gold-silver ratio say about silver?
Silver forecasts look like noise when you line them up as prices. Convert them into gold-silver ratio calls, though, and every forecaster is suddenly answering one question.
The ratio measures how many ounces of silver buy an ounce of gold. It sits at 67.3 today. In late January, at silver’s peak, it fell below 45, on J.P. Morgan Global Research’s reading.
Estimates of the long-run average vary by source and by window, so treat any single band carefully. J.P. Morgan puts the modern-era average at roughly 55 to 70. Other century-long series put it nearer 47 to 65. At 67.3, silver therefore sits at the top of the first range and just above the second.
Shearer’s view is specific. The rebalancing of silver’s physical market points to the ratio normalising toward 70 through the second half of 2026, and around 75 in 2027.
Read that carefully. It is not a forecast that silver falls apart. Rather, it is a forecast that silver underperforms gold. Gold keeps its structural bid, and silver does not get one.
The bullish case is the mirror image. Every genuinely aggressive silver target is a ratio-compression argument underneath. It needs the ratio to roughly halve from here. Some of those targets are arithmetic exercises rather than forecasts. Pick a compressed ratio, multiply by the gold price, publish the number.
Is silver’s next buyer monetary or industrial?
That is the only question that decides it.
If the buyer is monetary, the ratio compresses and silver outperforms. If the buyer is industrial, the ratio does what Shearer says. After all, industrial demand is the thing being actively engineered out.
Roughly 50 to 55% of annual silver demand is industrial, on Silver Institute figures: electronics, solar, electric vehicles and medical uses. That dual nature is why a single silver price must clear two unrelated demand curves at once. It is also why silver’s forecast range is always wider than gold’s.
What could break the bearish case?
Two things could break Shearer’s thesis. Both deserve watching rather than dismissing.
India may reverse. That 15% import duty is under active review. Outlook Business reported in late August 2026 that the government is weighing a cut back to 6%, driven by a jump in smuggling and pressure from the bullion trade. However, no decision has been made and no notification has issued. The 15% rate stands today. If it does reverse, one of the two policy shocks behind the demand-destruction case unwinds.
The buyer is already changing. Inside a roughly flat headline deficit, the composition of demand is rotating hard. Physical investment demand in coins and bars should rise sharply this year, according to the Silver Institute, reaching its highest level since 2022. US retail demand is rebounding strongly. Meanwhile industrial buyers are engineering silver out, and investors are absorbing what they release.
That rotation is not cosmetic. Moreover, it points somewhere specific.
Why does silver storage matter to the forecast?
An ounce consumed in a solar panel is gone. It disperses across a rooftop in quantities too small to recover economically.
An ounce bought as a coin or a bar is not gone. It still exists, it still trades, and it has to sit somewhere under someone’s terms.
Suppose the marginal buyer shifts from a manufacturer who destroys the ounce to an investor who stores it. The market’s available float then starts depending on storage arrangements rather than mine output. That is a price mechanism, not an administrative footnote.
We have seen what happens when float and storage terms come apart. Unencumbered availability in London vaults fell to a historic low near 17% in September 2025, according to Metals Focus. The squeeze that followed in October sent lease rates spiking. The metal existed. It simply was not available.
Is every kind of silver exposure the same?
No. If you are acting on any silver forecast, how you hold it is part of the position. It is not a detail to sort out later.
An exchange-traded fund gives you the price. It does not necessarily give you the right to take delivery of the metal. In a squeeze, that distinction is the whole thing.
For metal you can take possession of, three questions matter. Where does it sit? Is it allocated to you specifically? What would you do to get it in hand? Those are answerable: see how vaulted, allocated storage works. For retirement money, silver can be held inside an IRA with a custodian rather than a taxable account.
None of that tells you where silver trades in December. Instead, it says something simpler. If the deficit thesis is right, the beneficiaries hold metal rather than a claim on it.
So what is the silver price prediction for 2026?
The range of credible outcomes is wide, and anyone telling you otherwise is selling you something. What follows is the structure of the disagreement, which is more durable than any single number.
- Base case, from the most recently revised major forecast: silver averaging around $63 in the fourth quarter, with the ratio widening toward 70 and then 75. Silver underperforms gold.
- The bull case needs the ratio to compress substantially. That in turn needs silver’s marginal buyer to be monetary rather than industrial.
- What decides it is the size of the solar demand decline. Not the Fed, and not the deficit headline.
- Watch Chinese and Indian import data, panel silver loading, and whether India’s duty reverses.
The full bull and bear case for silver sets out the wider spread of institutional views alongside this.
Finally, one note about forecasts. In May, a serious research team with full access to this data believed silver would average $90 in the fourth quarter. By August the same team believed $63. Treat every number here as what someone believes today, not as a fact about December.
Stay On Top of Gold & Silver Prices
Get important market alerts sent straight to your inbox.
People Also Asked
The most recently revised major bank forecast says roughly flat to slightly lower. J.P. Morgan Global Research projects a fourth-quarter average of $63.00 against spot near $64.44. The bull case argues for substantially higher. However, it depends on the gold-silver ratio compressing, which depends on investment demand outweighing the industrial demand being engineered out of solar panels.
Mainly because of expected demand destruction in solar. Gregory Shearer expects photovoltaic demand for silver to fall roughly 30% this year, or around 60 million ounces. Manufacturers are thrifting and substituting away from silver at high prices. Chinese destocking after the April 1 VAT rebate removal accelerated the shift. So did India’s May 13 duty increase to 15%. Higher interest rates are a secondary factor.
No. The World Silver Survey 2026 projects a sixth consecutive annual deficit in 2026, at 46.3 million ounces, widening from 40.3 million in 2025. The open question is not whether a deficit exists this year. Rather, it is how long the deficit persists if industrial demand keeps shrinking.
At 67.3 it sits well above the sub-45 reading at January’s peak. J.P. Morgan expects it to widen toward 70 this year and around 75 in 2027. That forecasts silver underperforming gold rather than silver collapsing.
Roughly 50 to 55%, across electronics, solar panels, electric vehicles and medical applications. Consequently silver behaves partly as a monetary metal and partly as a commodity levered to manufacturing. That is also why its forecasts scatter more widely than gold’s.
Yes, if the deficit thesis is what you are acting on. A shortage of physical metal rewards holders of physical metal. Price exposure through a fund is not the same as an allocated claim you can take delivery of. The October 2025 London squeeze made that distinction expensive for some holders.
SOURCES
1. J.P. Morgan Global Research — The Path for Silver Prices in 2026 and 2027 (August 13, 2026)
2. Silver Institute / Metals Focus — Global Silver Investment to Remain Strong in 2026 Against the Backdrop of a Sixth Consecutive Annual Market Deficit (February 10, 2026)
3. Bloomberg — Silver Market Set for Sixth Annual Deficit on Strong Bar, Coin Demand (April 15, 2026)
4. Investing News Network — Silver Institute: Sustained Supply Deficit Exposes Market to Squeezes (April 21, 2026)
5. MiningVisuals — Silver Market Balance: A 2026 Update (May 25, 2026)
6. CNBC — India Hikes Bullion Import Duties as the World’s Second-Largest Gold Market Faces a Declining Rupee (May 13, 2026)
7. Taxguru — Customs Duty on Gold and Silver Raised to 15%, Effective May 13, 2026 (May 15, 2026)
8. Outlook Business — Gold Duty U-Turn? Govt Mulls Cutting Import Tax From 15% To 6% (August 2026)
9. Silver Institute — Silver News: Global Silver Investment to Remain Strong in 2026 (February 2026)
10. GoldSilver — Silver Market Deficit 2026: Six Years and Getting Worse (April 16, 2026)
11. GoldSilver — Live Gold and Silver Price Charts (2:30 PM ET, September 1, 2026)
Disclaimer: This article is for informational purposes only and does not constitute investment advice. Past performance is not indicative of future results. Always consult a qualified financial advisor before making investment decisions.
You May Also Like:
- Will Gold Go Down for the Rest of 2026? Six Banks Cut Their Targets, and the Cuts Trailed the Price
- SLV Holds Your Silver. It Just Can’t Give It Back to You.
- What Are the IRS Rules for a Precious Metals IRA in 2026?
- Why Your Pension Can Own Gold and Your 401(k) Still Can’t
- Ten Percent Sent Gold Abroad. Nine Percent Brought It Home.
- Permanent Portfolio: Harry Browne’s 25% Gold Rule
- Australian Gold Kangaroo: The Bullion Coin Backed by an Act of Parliament
- What Is Sound Money? Why the Dollar Lost 87% of Its Value Since 1971
- Vault Storage vs. Gold ETFs: Who Owns the Gold You Paid For?