Published: 04-16-2026, 06:01 pm
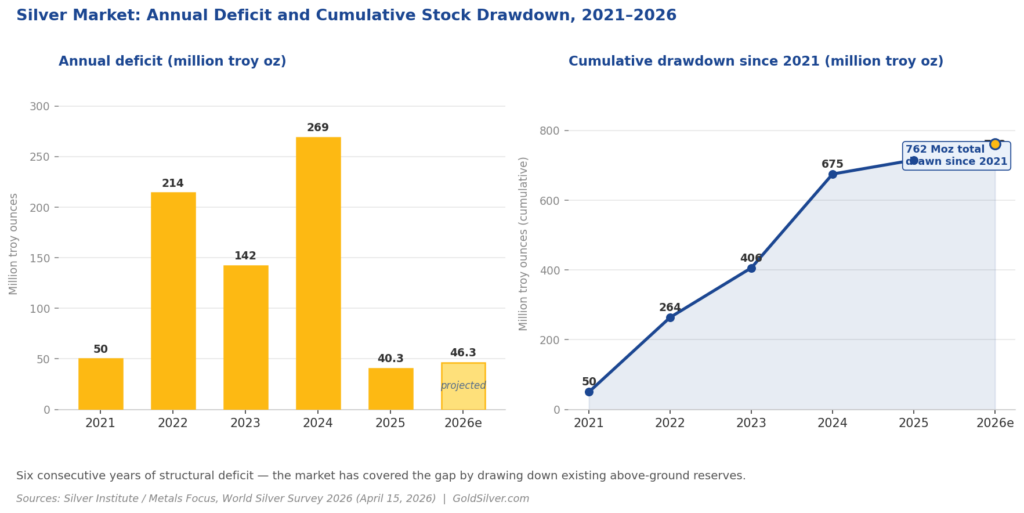
The global silver market is heading for its sixth consecutive annual supply deficit in 2026. The projected shortfall is 46.3 million troy ounces, according to the World Silver Survey 2026, published by the Silver Institute and Metals Focus on April 15, 2026. Since 2021, the market has drawn down a cumulative 762 million troy ounces from above-ground stocks to cover the gap between supply and demand. That number has no modern precedent.
Silver has dropped 35% from its January 2026 record of $121.62 per ounce. That gets the headline. But reserves drawn down over five years to cover what mining cannot produce — that’s the story. The price is down. The deficit is up. Those two facts point in opposite directions, and understanding why is worth more than watching the chart.
What is the silver market deficit in 2026?
The 2026 silver market deficit is projected at 46.3 million troy ounces — up 15% from 40.3 million ounces in 2025. It is the sixth consecutive year that global silver demand has exceeded total supply, according to the World Silver Survey 2026 (Silver Institute / Metals Focus, April 15, 2026).
That deficit is widening even as total demand is expected to fall 2%. The reason: supply is falling faster. Total global silver supply is also forecast to decline 2% in 2026, as producer hedging normalizes after a sharp jump in the second half of 2025. When both sides of the ledger are shrinking and the gap is still growing, the physical market is getting tighter — not looser.
Why does the silver deficit keep widening?
Silver answers to two structurally separate demand pools that rarely move in the same direction. It is an industrial necessity — irreplaceable in solar panels, EVs, and semiconductors. It is also a monetary metal, held as a store of value against currency debasement. When both are pulling at once, supply has nowhere to flex.
A structural deficit means total demand has exceeded total supply for six consecutive years. Unlike a temporary shortage, it doesn’t resolve on its own. The causes — inelastic industrial demand, constrained mine supply — don’t move quickly. Mine supply is especially rigid: most silver is extracted as a byproduct of gold, copper, and zinc operations. Higher silver prices don’t automatically produce more silver.
When the market runs short, it doesn’t go empty. It draws down above-ground silver stocks — metal held in exchange vaults, institutional storage, and dealer inventories built up over decades. Since 2021, those stocks have been drawn down by 762 million troy ounces (Silver Institute, April 2026). Six years of living on reserves.
How long can that continue?

The Edge Every Investor Needs Smarter precious metals investing starts here. The Nuggets Newsletter brings you essential market insights, Fed updates, global trends, educational videos, and much more.
What happened in the London silver market in 2025?
Available silver in London vaults fell to a historic low of 17% unencumbered in September 2025 — triggering the October 2025 physical liquidity squeeze that sent lease rates spiking, according to Philip Newman, Managing Director at Metals Focus, in the World Silver Survey 2026.
Unencumbered London vault silver is the share of metal held in London vaults that is not tied to exchange-traded products — and therefore actually available for immediate delivery. At the time of the squeeze, London vaults held 884 million ounces in total. Only 17% of that — around 150 million ounces — was free to move.
As of end-March 2026, that share has recovered to 28% — the highest level since January 2025 (Metals Focus, April 2026). But in Newman’s own assessment: the recovery is real, but it is fragile. Another wave of Indian physical buying, fresh inflows into London-based ETPs, or a sharp price move could recreate the conditions for a squeeze.
That is not speculation. It is the arithmetic of a market running a deficit for the sixth straight year.
Why is silver’s price down while the deficit is getting worse?
Silver is trading around $80 per ounce — down roughly 35% from its all-time record of $121.62 set on January 29, 2026. The physical market, meanwhile, is structurally tighter than it was when silver was at $40.
Short-term price is driven by financial markets: futures positioning, ETP outflows, dollar strength, and risk-off pressure from the Iran conflict. The structural deficit is a slower, less visible force. It doesn’t move the price tomorrow. It erodes the buffer that contains the next demand shock.
COMEX registered silver inventories — the exchange’s measure of metal actually available for futures delivery — have fallen roughly 75% since 2020. From approximately 346 million ounces to around 88 million (COMEX data, February 2026). Meanwhile, coin and bar demand is forecast to rise 18% in 2026, driven by a recovery in U.S. retail buying (World Silver Survey 2026). More buyers, less metal.
A 35% price discount on an asset with worsening fundamentals is either a warning or an opportunity. Which one depends entirely on your time horizon.
What does the silver deficit mean if you own physical silver?
The World Silver Survey just handed you the bull case in plain numbers. Six consecutive deficits. Irreplaceable industrial demand. A gold-to-silver ratio of 61:1 — still well below the 100:1 extreme hit in April 2025.
The structural case doesn’t require the price to move tomorrow. It requires the deficit to continue — which it has, every year since 2021. The deficit is the thesis. The price is noise.
That case looks like this in practice. Physical silver is:
- In structural annual deficit — every year since 2021, without exception (Silver Institute, 2026)
- Irreplaceable industrially in solar panels, EVs, semiconductors, and AI infrastructure
- Trading at a compressed ratio to gold — 61:1 today vs. above 100:1 in April 2025
- Recovering in retail demand — coin and bar purchases forecast up 18% in 2026 (World Silver Survey 2026)
That is not a fear trade. That is supply-and-demand analysis from the largest silver research institution in the world.
Stay On Top of Gold & Silver Prices
Get important market alerts sent straight to your inbox.
SOURCES
1. Silver Institute / Metals Focus — World Silver Survey 2026
2. GlobeNewswire / Silver Institute — Elevated Lease Rates, Regional Liquidity Tightness, and Robust Investor Interest Resulted in Record Silver Prices in 2025
3. Silver Institute — Global Silver Investment to Remain Strong in 2026 Against the Backdrop of a Sixth Consecutive Annual Market Deficit
4. CME Group — Silver Overview (COMEX Warehouse Stocks)
5. Metals Focus — World Silver Survey
By the GoldSilver Editorial Team — helping investors understand sound money since 2005. This article is for informational purposes only and does not constitute financial, investment, or tax advice. Always consult a qualified financial advisor before making investment decisions.
You May Also Like:
- Is the Petrodollar Ending? What the Iran War Means for Gold
- France’s Gold Repatriation Is Done. Germany Is Next
- Gold/Silver Ratio Hits 61.1 — Silver’s Turn to Run
- Silver Holds Near $80 as Iran Ceasefire Revives Rate-Cut Bets
- The Fed Goes Silent in 3 Days – What Does That Mean For Gold?
- Gold Is Down 10% From Its War-Peak — and Still Up 46% in a Year
- Gold Outranks the Dollar at Central Banks — What It Means for Your Savings