Silver Rises Over 120% YTD




Published: 09-28-2026, 03:13 pm
Gold trades near $4,129.62 and silver near $61.16 as of Monday, September 28, 2026. Both are down sharply this week. Gold is off 3.6%. Silver is off 4.9% from Friday’s close. Most of the coverage has focused on why: rising U.S. real yields, a stalled U.S.-Iran diplomatic track, and Fed-hike-odds repricing. That story is real, and GoldSilver has already covered it in detail.
Something else is happening at the same time, several thousand miles away. Almost nobody has connected it to gold at all.
On Monday, Japan’s two-year government bond yield climbed to 1.975%, according to Bloomberg. That’s its highest level since 1995. Three decades. For most of that period, Japan’s government paid its own savers close to nothing to hold its debt. The market is now pricing a continuation of the Bank of Japan’s hiking cycle, not a single adjustment. That fact matters more to gold’s long-term thesis than this week’s price move does.
Key Takeaways:
- Japan’s 2-year government bond yield hit 1.975% on Monday, September 28, 2026, its highest level since 1995, as the market prices continued Bank of Japan rate hikes.
- This is not the same story as the BOJ’s actual rate decision, which GoldSilver already covered when it landed on Friday, September 18, 2026. That was one hike. This is the market pricing in more hikes.
- Gold’s real competition isn’t one country’s bond. It’s the entire global stock of “safe” sovereign debt, and for the first time this cycle, the U.S. and Japan are repricing that stock higher at the same time.
Why Is a Japanese Bond Yield a Gold Story?
Gold pays no coupon, no dividend, and no interest. Every time you hold it, you give up whatever a risk-free government bond would have paid you instead. That forgone interest is gold’s real, structural cost of ownership. Economists call it the opportunity cost, and it’s the single number that actually moves gold’s price over multi-year periods. It’s more reliable than the nominal rate headlines usually quote. When risk-free yields rise, gold has to work harder to justify being held instead of a bond. When risk-free yields fall, or turn negative in real terms, gold’s relative advantage widens instead.
Here’s the mistake: thinking “risk-free yields” means only the U.S. 10-year Treasury. Instead, it means the entire global stock of sovereign debt that savers treat as safe. For three decades, Japan supplied an enormous share of that stock at a price of almost zero. Japanese pension funds, insurers, and individual savers had nowhere better to go for genuine safety, for most of the 21st century. Some of that capital went looking for yield abroad. Some of it, over the decades, found its way into gold instead.
That dynamic is changing now, and the two-year JGB is the clearest place to watch it happen. The 10-year reflects long-run growth and inflation expectations. The two-year is different. It’s the maturity most sensitive to what the market believes the central bank will do in the near term. So a rising two-year JGB is the market saying more hikes are coming, and soon.
The Knowledge That Changes Everything

Two essential guides — yours free. Understand why gold matters and why fiat currencies always fail.
Is This Just a Recap of the September Hike?
No. GoldSilver covered the Bank of Japan’s actual rate decision when it happened. The policy rate moved from 1.00% to 1.25% on Friday, September 18, 2026. That was the fourth hike since the BOJ exited negative rates in 2024. It was a single, discrete event, and gold barely reacted to it at the time.
What’s happening now is different in kind, not just in degree. A single hike is a data point. However, a two-year yield at a 31-year high, moving higher as the market prices further tightening, is a trend instead. Trends are what actually move the multi-year opportunity-cost math that gold’s price responds to. In short, the September hike told you what the BOJ did. This week’s JGB move tells you what the market now expects the BOJ to keep doing.
What Does the Consensus Get Wrong About This Week’s Selloff?
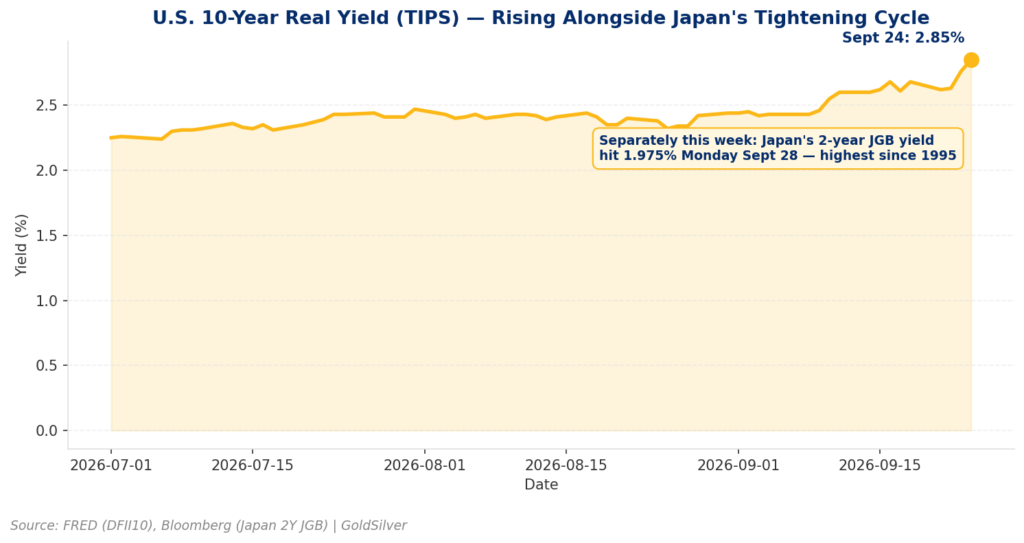
The consensus reading of this week’s overall precious-metals selloff treats it as a U.S. story: real yields up, Fed-cut odds down, gold down. That’s not wrong, exactly. The 10-year Treasury Inflation-Protected Security (TIPS) yield is the cleanest read on the “real” return on the safest U.S. asset, per Federal Reserve Economic Data (FRED). It rose from 2.62% to 2.85% in three trading sessions this week, a 23-basis-point move. Historically, a move of that size in real yields has been enough on its own to pressure gold by $40 to $60 an ounce.
Here’s what the U.S.-only framing misses, though. This is the first time since gold’s post-2008 monetary-debasement bull market took hold that two of the world’s largest sovereign bond markets, the U.S. and Japan, are repricing higher at the same time. They’re doing it for related but distinct reasons, rather than one tightening while the other holds near zero.
Ray Dalio, for instance, has drawn a sharp distinction between the two situations. Japan’s government debt is held almost entirely domestically. As a result, the Bank of Japan can manage its own transition without foreign creditors rushing for the exit, at the cost of a weaker yen. Meanwhile, the U.S. relies on foreign creditors for roughly a third of its debt. So an equivalent move there is riskier, and potentially more destabilizing. In other words, the mechanisms differ. Still, the direction, less “free money” for the world’s savers, does not.
What Does This Actually Test for Gold?
Gold’s decade-plus bull thesis has never really been stress-tested by this. Both of its two largest “safe alternative” bond markets are growing less generous at once. That test is beginning now. Suppose a 2% Japanese bond and a sub-3% U.S. real yield together still can’t out-compete gold for allocation. That’s after thirty years in which Japan alone offered almost nothing. If so, that would say something durable about how savers actually weigh certainty of purchasing power against a slightly better nominal return.
It’s worth being honest about the counterargument, too. A rising JGB yield is bullish for the yen. In theory, that could reduce Japanese demand for gold as a currency hedge specifically. After all, a stronger yen makes gold priced in yen relatively more expensive. That can dampen retail buying in Japan even as the broader global opportunity-cost story tightens. However, both effects are real, and they point in different directions. Still, a single week of price action can’t answer which one dominates. That’s one more reason this is a structural story to watch over quarters, not a verdict to draw from Monday’s close.
Morgan Stanley strategist Mike Wilson, for example, proposed a 60/20/20 portfolio in 2025: 60% stocks, 20% short-term bonds, 20% gold. His reasoning was explicit. Traditional bonds no longer reliably diversify a portfolio the way they once did. As a result, that case gets harder to dismiss, not easier, in a world where “safe bonds” everywhere are paying more. But so is the uncertainty of holding any single government’s paper through a tightening cycle. Most of the developed world hasn’t seen one in a generation.
What Should This Mean for Your Own Portfolio?
None of this is a reason to react to a single week’s price move, down or up. Instead, it’s a reason to understand what actually competes with gold in your own portfolio. That competition isn’t one country’s 10-year bond. Rather, it’s the entire, shifting global stock of paper that claims to be risk-free. For three decades, Japan quietly subsidized that claim by asking its own savers to accept almost nothing in return. That subsidy is ending now. What replaces it is the real question. So is how much of a portfolio deserves to sit in an asset that pays no yield at all, but also answers to no central bank. This week’s headlines are pointing at that question, even if almost none of them are asking it directly.
Live, U.S.-dollar spot prices for both metals are unaffected by any single country’s bond market. They’re tracked in real time at GoldSilver’s price charts.
Stay On Top of Gold & Silver Prices
Get important market alerts sent straight to your inbox.
People Also Asked
What is Japan’s 2-year government bond yield, and why does it matter for gold?
Japan’s 2-year government bond (JGB) yield is the return investors demand to hold Japanese government debt for two years. It is the maturity most sensitive to what the market expects the Bank of Japan to do with rates in the near term. On Monday, September 28, 2026, it climbed to 1.975%, its highest level since 1995, per Bloomberg. It matters for gold because gold pays no yield. It constantly competes with the return available on “safe” government debt instead. So when a yield like this keeps rising on expectations of more hikes, gold’s relative advantage narrows.
Is a rising Japanese bond yield different from a rising U.S. Treasury yield, for gold’s price?
Both raise gold’s opportunity cost the same basic way. A higher “safe” yield anywhere makes gold, which pays no yield, relatively less attractive to hold. The mechanisms differ, though. Japan’s debt is held almost entirely domestically. That lets the Bank of Japan manage its tightening without foreign creditors rushing for the exit, at the cost of a weaker yen. Meanwhile, the U.S. relies on foreign creditors for roughly a third of its debt, making an equivalent move riskier there. So what’s new in September 2026 is that both are repricing higher at once, not just one of them.
How is the “opportunity cost” of holding gold actually calculated?
Opportunity cost is the return you give up by holding gold instead of a comparable safe asset. It’s typically measured against the real, inflation-adjusted yield on government bonds. Historically, a 25-basis-point move in real yields has moved gold’s price by roughly $40 to $60 an ounce, on its own. This week, the U.S. 10-year real yield (the TIPS yield, per FRED) rose 23 basis points in three sessions, from 2.62% to 2.85%. That’s consistent with the historical relationship.
What is the risk to gold if Japan’s tightening cycle continues?
The main risk is straightforward. A genuinely sustained rise in Japanese yields, stacked on already-elevated U.S. real yields, raises gold’s global opportunity cost. That’s a longer story than one week’s price move can capture. There’s also a secondary, opposite-direction risk. A rising JGB yield tends to strengthen the yen, and a stronger yen makes gold priced in yen more expensive. That can specifically dampen Japanese retail demand, even as the broader global picture tightens. Both effects are real, though, and a single week of price action can’t yet say which one dominates.
Did the Bank of Japan’s rate hike in September 2026 already cause this week’s move?
No, and that distinction is the point of this analysis. The Bank of Japan’s actual rate decision, a hike from 1.00% to 1.25%, landed on Friday, September 18, 2026. Gold barely reacted to it at the time, because it was a single, already-anticipated event. This week’s 2-year JGB move is different, though. It reflects the market pricing a continuation of that hiking cycle, not the hike itself. In short, a single rate decision is a data point. A rising forward-looking yield is a trend instead, and trends are what move gold’s multi-year opportunity-cost math.
What happens to gold if both Japan and the U.S. keep raising real yields at the same time?
Nobody can answer that with certainty yet. That’s precisely the value of watching it, rather than assuming an outcome. Gold’s decade-plus bull thesis has never been tested by this exact setup. Both of its two largest “safe alternative” bond markets, the U.S. and Japan, are growing less generous at once. Suppose a roughly 2% Japanese bond and a sub-3% U.S. real yield together still can’t out-compete gold for allocation. That’s after thirty years in which Japan alone offered savers almost nothing. If so, that would say something durable about how investors actually weigh certainty of purchasing power against a modestly better nominal return.
SOURCES
1. Bloomberg – Japan’s Two-Year Bond Yield Nears 2% as BOJ Rate Hike Bets Mount – September 28, 2026
2. FRED (Federal Reserve Economic Data) – 10-Year Treasury Inflation-Indexed Security, Constant Maturity (DFII10) – Observation Date September 24, 2026
3. GoldSilver – The Bank of Japan Just Hiked to a 31-Year High. Gold Barely Noticed. – September 18, 2026
4. The New York Times, Interesting Times with Ross Douthat – A Legendary Investor on How to Prevent America’s Coming ‘Heart Attack’ – May 7, 2026
5. Reuters (via U.S. News & World Report) – Morgan Stanley CIO Favors 60/20/20 Portfolio Strategy With Gold as Inflation Hedge – September 16, 2025
Disclaimer: This article is for informational purposes only and does not constitute investment advice. Past performance is not indicative of future results. Always consult a qualified financial advisor before making investment decisions.
You May Also Like:
- What Is a FOMC Meeting? What the Fed Decides and How Gold Reacts
- Gold in Your Phone: How Much Gold Is in Electronics and What It Means for Demand
- Real Yields vs. Nominal Rates: The Number That Actually Moves Gold
- How to Read a Gold Spot Price Chart: The 4 Things That Actually Matter
- Central Banks Hold 80% of Reserves in Gold. Sovereign Wealth Funds Hold Under 1%.
- You Don’t Need to Take Delivery to Sell Your Gold. Here’s What Actually Happens.
- The Real Price of a 1 Gram Gold Bar Isn’t $140
- What Are Negative Real Interest Rates, and Why Does Gold Thrive in This Environment?