Silver Rises Over 120% YTD




Published: 09-21-2026, 03:43 pm
Something doesn’t add up in the gold market right now. Real interest rates, the exact force that is supposed to make gold expensive to hold, sit near a multi-year high. By the textbook, gold should be struggling. Instead, it trades close to record levels. That gap traces back to one concept every long-term investor should understand cold: negative real interest rates, and why gold has always thrived once they show up.
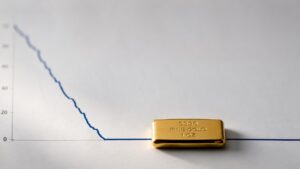
Gold price (USD/oz) vs. 10-year real yield (TIPS, inverted) at key historical negative/positive-real-rate episodes. Sources: public-record gold price history; Federal Reserve Economic Data (FRED), series DFII10. Chart shows episode markers, not a continuous daily series.
What Are Negative Real Interest Rates?
Negative real interest rates occur when inflation exceeds the nominal interest rate, making the true, inflation-adjusted return on cash or bonds negative. Savers lose purchasing power even while their account balance keeps growing, and gold, which pays no interest at all, tends to thrive the moment this math turns negative for everyone else.
The real interest rate is simple arithmetic. Take the nominal interest rate and subtract the inflation rate. A savings account paying 4% during a year when inflation runs at 6% delivers a real interest rate of -2%. The saver’s money grows on paper while its purchasing power shrinks in practice. When that gap turns negative across the broader economy, economists call it a negative real interest rate environment. It changes the incentives facing every holder of cash, bonds, or fixed-income assets.
The Knowledge That Changes Everything

Two essential guides — yours free. Understand why gold matters and why fiat currencies always fail.
What Is Financial Repression?
Economists have a name for the deliberate version of this pattern: financial repression. Governments and central banks sometimes keep rates below inflation on purpose. Doing so quietly shrinks the real value of government debt over time. It moves wealth from savers toward debtors, including governments with large debt loads. Savers earn negative real returns on cash and bonds. Debtors get to pay their debt back in cheaper dollars.
Financial repression is not a conspiracy theory. It is a well-documented policy pattern. It tends to show up once government debt gets so large that raising rates to a normal level would make interest payments too costly to bear.
Why Does Gold Do Well When Real Rates Turn Negative?
Every asset carries a cost of ownership. For a bond, that cost is simple: the buyer gives up the interest available elsewhere. Gold works differently, because gold pays no coupon and no dividend. As a result, the true cost of holding gold is whatever yield an investor gives up by not holding cash or bonds instead. That forgone yield is the opportunity cost. It is the entire mechanism connecting interest-rate policy to the gold price.
When real interest rates are strongly positive, that opportunity cost is real and painful. An investor holding gold visibly gives up meaningful, inflation-beating income elsewhere. Once real rates fall toward zero and below, though, the opportunity cost shrinks and eventually vanishes. Gold’s lack of yield stops being a drawback, because nothing else pays an attractive yield either. Investors then rotate toward the asset that reliably preserves purchasing power, instead of the one that merely promises a nominal number. That rotation is what drives sustained gold bull markets. Negative real yields have historically been the single most reliable environment for exactly this kind of extended move.
This is not just theory. J.P. Morgan Private Bank has shown that gold’s biggest rallies of the past two decades, in 2008 to 2012 and 2019 to 2021, lined up closely with the stretches when real yields actually turned negative, exactly the mechanism just described. [J.P. Morgan Private Bank] Today’s real yield tells a different story, covered next.
What Happened to Gold During the 1970s Negative-Rate Era?
History offers three clean test cases. Each one plays out the same mechanism at a different scale.
The 1970s produced the largest gold bull market on record. The United States severed the dollar’s convertibility to gold in August 1971. Inflation then accelerated through the decade and outran short-term interest rates for extended stretches. Gold rose from a fixed $35 an ounce to a peak of $850 by January 1980, a gain of roughly 2,300%. Consumer prices peaked near 14.8% in March 1980. Real short-term rates stayed deeply negative for much of the decade. The rally only broke once Federal Reserve Chair Volcker pushed the federal funds rate toward 20% in 1981. That move flipped real rates sharply positive and sent gold down toward $300 within two years.
How Did Gold Perform From 2008 to 2011?
The 2008 to 2011 period repeated the 1970s pattern at a smaller scale. The Federal Reserve cut rates to zero and launched successive rounds of quantitative easing. As a result, the 10-year TIPS real yield fell from roughly +2.5% to about -0.5%. Gold rose from around $700 an ounce to nearly $1,900 over the same window, tracking the decline in real yields closely.
What Happened During the 2020 to 2021 COVID Era?
The 2020 to 2021 COVID era squeezed the same mechanism into a much shorter window. The Fed cut rates to zero and bought bonds at a record pace. As a result, the 10-year real yield fell to roughly -1.0%. Gold jumped more than 40% in about eighteen months. It set a then-record above $2,070 an ounce in August 2020.
PIMCO tested how tight this link really is. The firm ran the numbers from 2004 through 2025. It found that a 1-point move in the 10-year real yield lines up with roughly an 18% move in the gold price, once adjusted for inflation. PIMCO calls this gold’s “real duration”: about 18 years. [PIMCO]
Are Real Interest Rates Negative Right Now?
Not currently. This distinction matters more than most gold coverage acknowledges. The most recent Federal Reserve data, dated September 17, 2026, puts the 10-year TIPS real yield at 2.61%, near multi-year highs. Ten-year breakeven inflation expectations sit at 2.33%. [FRED] In plain terms, the bond market is pricing a comfortably positive real return for anyone willing to hold inflation-protected Treasuries to maturity. That is the opposite of the setup that powered the 1970s, 2008 to 2011, and 2020 to 2021 rallies.
Yet gold has kept trading near record levels through this same period. That gap is the real puzzle worth understanding, rather than a formula to simply memorize. J.P. Morgan Private Bank has noted that the tight, decades-long inverse relationship between gold and real yields broke down structurally starting in 2022. Gold has since traded well above what a real-yields-only model would predict. [J.P. Morgan Private Bank]
Why Is Gold Still Strong If Real Rates Aren’t Negative?
Most institutional researchers point to a different cause. It is not a second wave of financial repression. It is central bank buying, and that buying runs on its own separate track, apart from the rate cycle. Central banks bought a record 1,082 tonnes of gold worldwide in 2022. They followed that with 1,037 tonnes in 2023, the two highest totals on record. Central banks alone drove roughly a quarter of all gold demand in both years.
That buying has stayed strong since then. It reflects reserve choices made by finance ministries, not a bet against bond yields. As a result, gold’s share of official global reserves has climbed from around 10% in 2015 to about 18% by 2024, per IMF data. That is the first sustained rise in gold’s reserve role since the 1970s.
This is the deeper point behind the whole topic. The real-rates mechanism explains gold’s shorter swings. It does not explain gold’s current floor. A saver today, earning a positive real yield on a savings account, is not living through the 1970s or 2020 playbook at all. Even so, gold has kept climbing anyway. A second buyer has stepped in: sovereign reserve managers, whose choices do not depend on the Fed’s next rate decision. For close to three years now, central banks have quietly kept adding to gold holdings held outside the ordinary banking system. They increasingly treat gold less as a rate trade and more as a core reserve asset.
Does the Real-Rate and Gold Relationship Always Hold?
Not on a guaranteed, short-term basis. Negative real rates lower gold’s opportunity cost and have historically coincided with gold’s strongest multi-year rallies. Gold prices also respond to central bank demand, currency moves, and investor sentiment, though. PIMCO’s own modeling treats real yields as one major input, not the only one. The years 2022 through 2026 show gold trading well above what a real-yields-only model would predict, precisely because that second driver, central bank demand, has taken over part of the job real yields used to do alone.
What Does This Mean for Investors Going Forward?
For an investor trying to time gold using real rates alone, today’s picture sends a mixed signal. Real yields sit at high levels by recent standards, which would normally argue for caution. Central bank buying sits at high levels too, though, and that argues the opposite. So watching one data point alone, such as the 10-year TIPS yield, is no longer enough.
A more complete framework tracks two variables side by side. The first is the direction of real yields, which still governs gold’s shorter cyclical swings; a deeper look at that broader relationship is worth a separate read. The second is quarterly central bank purchase data from official sources, which now governs the newer structural floor beneath the price.
Meanwhile, the underlying lesson of negative real interest rates extends beyond the current cycle, too. Any future return to sustained negative real rates, whether driven by another debt-driven period of financial repression or an inflation surprise, would reintroduce the exact mechanism that powered the 1970s, 2008 to 2011, and 2020 to 2021 rallies. This time, it would arrive on top of a central bank buying base that did not exist during those earlier episodes. Recent coverage of bank forecasts tied to real-rate assumptions shows how closely Wall Street still watches this one variable, even amid the current decoupling.
Stay On Top of Gold & Silver Prices
Get important market alerts sent straight to your inbox.
People Also Ask
No. Inflation is the rate at which prices rise. A negative real interest rate is what happens when that inflation rate exceeds the nominal interest rate paid on cash or bonds. High inflation paired with an even higher interest rate would not produce negative real rates. Modest inflation paired with a near-zero interest rate can.
The nominal rate is the stated rate on a savings account, bond, or loan. The real rate subtracts inflation from that number, showing the true change in buying power. A 5% Treasury yield during 6% inflation gives a real yield of -1%. A 3% yield during 1% inflation gives a real yield of +2%. The lower headline number can still be the better real deal.
Not on a short-term or guaranteed basis. Negative real rates lower gold’s opportunity cost. They have historically coincided with gold’s strongest multi-year rallies. Gold prices also respond to central bank demand, currency moves, and investor sentiment. PIMCO’s own modeling treats real yields as one major input, not the only one, and 2022 through 2026 shows gold trading well above what a real-yields-only model would predict.
TIPS stands for Treasury Inflation-Protected Securities. It is a US government bond whose value adjusts with inflation. TIPS strip inflation out of the yield directly. Because of that, the 10-year TIPS yield (FRED code DFII10) is the most common real-time gauge of the real rate. It differs from the plain nominal 10-year Treasury yield.
Yes, and this causes a lot of confusion. A nominal interest rate of 3% is still positive on its face. If inflation runs at 5%, though, the real interest rate is -2%. Investors who only watch the nominal rate can easily miss that they are losing purchasing power in real terms.
Financial repression is the policy of holding rates below inflation on purpose, not by accident. Between 2008 and 2022, US 10-year Treasury yields averaged near 2.5% while inflation averaged near 2.3%. Real returns stayed close to zero, before taxes, for over a decade. That is a mild version of the same pattern that ran far hotter in the 1970s.
SOURCES
1. FRED — Market Yield on U.S. Treasury Securities at 10-Year Constant Maturity, Inflation-Indexed (DFII10)
2. FRED — 10-Year Breakeven Inflation Rate (T10YIE)
3. J.P. Morgan Private Bank — Is It a Golden Era for Gold?
4. PIMCO — Understanding Gold Prices
5. International Monetary Fund — 2025 Annual Report, Appendix I: International Reserves
Disclaimer: This article is for informational purposes only and does not constitute investment advice. Past performance is not indicative of future results. Always consult a qualified financial advisor before making investment decisions.
You May Also Like:
- Cheapest Way to Buy Gold? We Measured 110 Live Prices
- How Much Silver Should You Own? A Portfolio Allocation Guide by Age and Goal
- Who Owns US Debt? Central Banks Own Less Than You Think
- What Is Junk Silver? The Old Dimes and Quarters Worth Nearly 50x Their Face Value
- Why Is Silver Demand Tied to AI Data Centers?
- The Copper Mine That Isn’t Trying to Mine Silver Just Explained the Whole Deficit
- Inherited Gold IRA: Beneficiary Rules & the Step-Up Basis Gap