Published: 06-22-2026, 02:55 pm
The Goldman Sachs gold cut sent its year-end target from $5,400 to $4,900 on June 19. JPMorgan held at $6,000. Wells Fargo held at $6,100 to $6,300. Deutsche Bank held at $6,000. Goldman’s own downside scenario sits at $4,400. The spread between the most cautious major bank and the most bullish is now $1,100 per ounce.
That is a lot of divergence among institutions looking at the same data. But the divergence isn’t random. It follows directly from a more fundamental disagreement: what kind of asset is gold?
Your answer to that question determines whether Goldman’s cut is signal or noise for your portfolio. The Goldman Sachs gold cut explained is not a bearish call — it is a model output. And the model it came from is not the only one on Wall Street.
Why Goldman’s Gold Model Produced a $500 Cut
Goldman’s gold model is rate-driven. Analysts Lina Thomas and Daan Struyven have quantified the relationship precisely. Every 50 basis points of Federal Reserve easing adds approximately $120 per ounce of support to gold prices. This works through two channels: lower opportunity cost for holding a non-yielding asset, and a weaker dollar [Goldman Sachs Global Investment Research, June 2026].
When Goldman built its January 2026 target of $5,400, that forecast included two Fed rate cuts baked in. One was penciled in for late 2026, one for early 2027.
On June 17, Federal Reserve Chair Kevin Warsh presided over his first FOMC meeting. He stripped forward guidance from the policy statement entirely. Nine of the 18 policymakers who submitted projections now favor at least one rate hike in 2026 [Federal Reserve, Summary of Economic Projections, June 2026]. Warsh himself did not submit a projection.
In response, Goldman’s economists pushed both 2026 cuts out of the year entirely. The first expected rate reduction was delayed to June 2027, the second to December 2027. Goldman’s formula runs at $120 per 50 basis points of Fed easing. Two standard 25bp cuts total 50 basis points, so removing that rate support from 2026 costs approximately $120 per ounce in the model. Reductions to Goldman’s ETF inflow assumptions account for the remaining $380 of the $500 cut.
Goldman’s own framing in the note: “structurally constructive but tactically cautious.” The structural case for gold was not revised. Only the tactical rate-path input changed.
The Knowledge That Changes Everything
Two essential guides — yours free. Understand why gold matters and why fiat currencies always fail.
What JPMorgan’s Model Is Looking At Instead
JPMorgan’s $6,000 year-end target rests on a different foundation entirely. Where Goldman’s gold model tracks rate sensitivity, JPMorgan’s framework weights quarterly demand tonnage as the primary price driver. JPMorgan’s own research estimates this relationship explains approximately 70% of quarter-over-quarter gold price movements [JPMorgan Global Research, May 2026].
On that metric, very little has changed. Central banks purchased 244 tonnes of gold in Q1 2026, including unreported purchases estimated by the World Gold Council [World Gold Council, Gold Demand Trends Q1 2026]. The People’s Bank of China added 9.95 tonnes in May alone, extending its buying streak to 19 consecutive months [Heraeus Precious Metals, June 2026]. Moreover, the World Gold Council’s 2026 survey found that 45% of central banks plan to grow their gold reserves over the next year. None plan to reduce holdings [World Gold Council, Central Bank Survey 2026].
None of those institutions are adjusting their reserve policies based on what the FOMC’s dot plot projects for December. Their purchase decisions run on timescales that make any single Fed meeting essentially irrelevant.
From JPMorgan’s perspective, the demand floor has not moved. Rate policy matters at the margin. However, the structural absorption of gold supply by sovereign balance sheets remains the primary force.
Major Bank Gold Price Targets — Year-End 2026
Goldman Sachs cut $500 from its target on June 19. JPMorgan, Wells Fargo, and Deutsche Bank held.
Sources: Goldman Sachs (June 2026), JPMorgan Global Research (May 2026), Wells Fargo Investment Institute (March 2026), Deutsche Bank (2026) | GoldSilver
Which Framework Matches Your Investment Thesis?
Goldman’s cut is correct within Goldman’s gold model framework. JPMorgan’s hold is equally correct within JPMorgan’s framework. Both can be simultaneously true because each framework answers a different question.
Goldman’s framework asks: what is the opportunity cost of holding gold relative to interest-bearing assets, and how does Fed policy affect that cost? This is the right question for an investor whose primary reason for holding gold is tactical — expressing a view on the rate cycle or the dollar.
JPMorgan’s framework asks: how much gold is being absorbed by committed buyers who are insensitive to short-term rate changes? This is the right question for an investor whose reason for holding gold is structural — reserve management, purchasing power protection, long-term debasement hedge.
So the question for you is not which bank is right. It is which framework describes your actual investment thesis.
Your Model Might Not Match Either Bank’s
There is a third framework that doesn’t appear prominently in either bank’s research notes, although Goldman has begun using the terminology for it.
Goldman calls it the “debasement trade.” It is one of the three core pillars of Goldman’s bullish thesis alongside central bank buying and ETF flows [Goldman Sachs via TheWealthAdvisor, 2026]. In short, the debasement trade describes investors purchasing gold not because they expect the Fed to cut rates next quarter. Instead, they believe the current monetary system structurally erodes the purchasing power of paper currency over time. The mechanism is deficit spending running at approximately 6 to 7% of GDP at full employment, with federal interest expense approaching $1 trillion annually.
This framework operates on a 5 to 10 year horizon. It is indifferent to whether the first rate cut comes in September 2026 or June 2027. A single FOMC dot plot revision does not move it.
Five years ago this framing was Austrian economics jargon. Today Goldman Sachs, JPMorgan, and Citi all use the phrase in institutional research. The thesis has been institutionally validated. The question is whether it describes your situation.
What to Watch If Goldman’s Gold Model Is Yours
If you own gold primarily as a rate-cycle trade, Goldman’s gold model is the one to monitor. Three data points drive it.
First, watch the CME FedWatch probability of a rate hike or cut at each FOMC meeting. Second, track the 10-year real yield. Currently it sits at approximately 2.18% — 4.48% nominal minus the Cleveland Fed’s core PCE nowcast — a historically restrictive level [Cleveland Fed Inflation Nowcasting, June 2026; TradingEconomics, June 2026]. Third, watch the May PCE price index release due this week. The Cleveland Fed projects core inflation at approximately 3.3% year-over-year, unchanged from April. A soft print could reverse some of Goldman’s tactical caution. A hot print reinforces the $4,400 downside scenario.
Under this framework, the thesis has weakened in 2026 and Goldman’s cut is signal. The correct response is to reduce exposure or wait for rate-cut probability to rise before adding.
What to Watch If JPMorgan’s or the Debasement Model Is Yours
If you own gold as a reserve asset or a long-term purchasing power hedge, the relevant data is different.
Watch the monthly World Gold Council central bank purchase reports. Also monitor the PBOC’s monthly reserve disclosures. Beyond that, track the US fiscal deficit as a percentage of GDP. It is currently running at approximately 6 to 7% at full employment. That means the structural debasement backdrop is worsening regardless of the Fed funds rate. Finally, the pace of Western gold ETF inflows matters as a leading indicator of rate-sensitive demand, since that is the channel Goldman’s model weighs most heavily.
Under these frameworks, Goldman’s cut changes nothing. The central banks buying 244 tonnes per quarter were not waiting for the June FOMC meeting. Furthermore, they are not waiting for the May PCE print. Their purchase decisions run on a timescale that makes the Fed funds rate a second-order consideration.
The Persistent Floor Gold Is Already Demonstrating
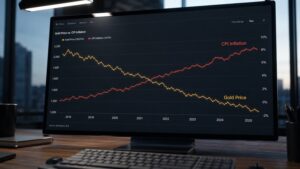
Here is a data point that illustrates the framework divergence in real time. The 10-year real yield is currently approximately +2.18%. Historically, gold has struggled when real yields are strongly positive, because the opportunity cost of holding a non-yielding asset rises sharply. Under Goldman’s gold model, gold should face significant headwinds at this level.
Yet gold is currently at $4,206 per ounce [goldsilver.com/price-charts/, June 22 2026]. That is approximately $700 above Goldman’s downside scenario and $200 above Goldman’s revised $4,900 year-end target.
Gold holding at these levels despite historically restrictive real yields is not an anomaly. Instead, it is evidence that a buyer base exists — central banks, physical buyers, long-term allocators — whose demand does not respond to opportunity cost calculations. That buyer base is precisely what JPMorgan’s model captures and Goldman’s gold model does not fully weight.
Two Different Watches, Two Different Dials
Goldman’s cut is not a verdict on gold. It is a model output. The Goldman Sachs gold cut is explained entirely by one changed input: the rate path. Goldman’s gold model was built to capture rate-sensitive Western capital flows. Within that scope, the cut is well-reasoned.
However, the structural demand for gold as a monetary reserve asset — as a hedge against persistent fiscal deficits and a store of purchasing power — none of that changed on June 19. The debasement thesis did not become less valid because Kevin Warsh’s first FOMC meeting was hawkish.
If your model matches Goldman’s gold model, their cut is worth taking seriously. If your model is JPMorgan’s or the debasement framework, you are watching a different set of dials entirely. Both positions can be correct simultaneously.
The $1,100 gap between Goldman and JPMorgan is not a disagreement about facts. Rather, it is a window into two entirely different theories of what money is, what gold is, and what role it plays in a portfolio over time. Understanding which theory you hold makes Goldman’s revision either the most relevant thing that happened in gold markets this month — or completely irrelevant to your position.
Stay On Top of Gold & Silver Prices
Get important market alerts sent straight to your inbox.
People Also Ask
Why did Goldman Sachs cut its gold price forecast in June 2026?
Goldman Sachs cut its year-end 2026 gold target from $5,400 to $4,900 on June 19, 2026. The bank’s economists pushed both remaining 2026 rate cuts out of the year entirely, delaying them to June 2027 and December 2027. Goldman’s gold model quantifies that every 50 basis points of Federal Reserve easing adds approximately $120 per ounce to gold’s price. Two standard 25bp cuts total 50 basis points, so removing that rate support from 2026 costs approximately $120 per ounce in the model. Reduced ETF inflow assumptions account for the remaining $380 of the $500 cut. When Fed Chair Kevin Warsh’s first FOMC meeting signaled a more hawkish posture, nine policymakers projected at least one 2026 rate hike. Goldman’s rate-path input changed, and the model output changed with it [Goldman Sachs Global Investment Research, June 2026; Federal Reserve, SEP June 2026].
Why didn’t JPMorgan lower its gold forecast when Goldman did?
JPMorgan’s $6,000 year-end target is based on a different analytical framework: quarterly demand tonnage rather than rate sensitivity. JPMorgan estimates that demand tonnage explains approximately 70% of quarter-over-quarter gold price movements. Central banks purchased 244 tonnes of gold in Q1 2026 alone, and 45% of central banks plan to continue growing gold reserves over the next year. Those buyers do not adjust reserve policy based on FOMC dot plots. So JPMorgan’s model inputs did not change when the Fed’s tone shifted [JPMorgan Global Research, May 2026; World Gold Council, Q1 2026 Gold Demand Trends].
What is the “debasement trade” Goldman Sachs refers to in its gold research?
The debasement trade describes investors purchasing gold to protect purchasing power as governments run persistent fiscal deficits. These deficits erode the real value of paper currency over time. Goldman Sachs identifies the debasement trade as one of the three core pillars of its bullish gold thesis, alongside central bank buying and ETF inflows. US federal interest expense is approaching $1 trillion annually, and the federal deficit is running at approximately 6 to 7% of GDP at full employment. Investors who hold gold for debasement reasons operate on a 5 to 10 year horizon and are largely indifferent to near-term Fed rate decisions [Goldman Sachs via TheWealthAdvisor, 2026].
What data should a long-term gold holder watch after Goldman’s cut?
If you hold gold as a long-term purchasing power hedge, the key data is not the CME FedWatch probability. Instead, watch monthly World Gold Council central bank purchase reports and PBOC monthly reserve disclosures. Also track the US fiscal deficit as a percentage of GDP, and the pace of Western gold ETF inflows as a leading indicator of rate-sensitive demand. Goldman’s gold model is most relevant to tactical traders with a rate-cycle thesis. For structural holders, the central banks buying 244 tonnes per quarter are the signal.
What is the difference between Goldman’s gold model and JPMorgan’s?
Goldman’s gold model treats gold primarily as a rate-sensitive macro asset — a hedge against low real yields and a weak dollar. When the Fed delays cuts, the model lowers its gold target. JPMorgan’s model treats gold as a reserve asset. Its price is driven by total demand tonnage from committed buyers — central banks, ETF investors, and physical buyers — who are largely insensitive to short-term rate changes. Both frameworks are internally consistent. The $1,100 gap between their year-end 2026 forecasts ($4,900 vs. $6,000) reflects framework divergence, not a factual dispute.
Is Goldman Sachs bearish on gold after its June 2026 cut?
No. Goldman’s own language in the June 2026 note was “structurally constructive but tactically cautious.” The bank maintained a positive year-end target. At $4,900, it implies upside from June 22’s spot price of approximately $4,207. Goldman’s explicit downside scenario is $4,400 if the Fed actually hikes. The structural case — central bank buying, the debasement trade, long-term ETF flows — was not revised. Only the near-term rate-path input changed [Goldman Sachs Global Investment Research, June 2026].
How does the 10-year real yield affect gold prices?
The 10-year real yield is the nominal Treasury yield minus inflation expectations. Gold tends to fall when real yields rise, because the opportunity cost of holding a non-yielding asset increases. A bond paying 2% real becomes more attractive relative to gold. The current real yield is approximately +2.18% — 4.48% nominal minus the Cleveland Fed’s core PCE nowcast — which is historically restrictive for gold. Nevertheless, gold is holding above $4,200. That suggests non-rate-sensitive buyers are absorbing supply at a pace that offsets the rate-driven headwind [Cleveland Fed Inflation Nowcasting, June 2026; TradingEconomics, June 2026].
SOURCES
1. Goldman Sachs Global Investment Research — Gold Price Target Revision, June 19 2026
2. Federal Reserve — FOMC Statement and Summary of Economic Projections, June 17 2026
3. JPMorgan Global Research — Gold Price Forecast 2026, May 2026
4. World Gold Council — Gold Demand Trends Q1 2026
5. World Gold Council — Central Bank Gold Reserves Survey 2026
6. TheWealthAdvisor — Goldman Sachs Updates Their Gold Outlook for 2026
7. Federal Reserve Bank of Cleveland — Inflation Nowcasting, June 2026
8. GoldSilver — Gold & Silver Spot Prices, June 22 2026
9. Heraeus Precious Metals — Weekly Metals Update, June 2026
Disclaimer: This article is for informational purposes only and does not constitute financial or investment advice. Always consult a qualified financial adviser before making investment decisions.
You may also like:
- Gold Is Down 25%. Morgan Stanley Says One Number Unlocks $5,200.
- Solar Cut 19% Silver. The Deficit Widened Anyway.
- Gold Down 26%. Barclays’ $4,791 Target Never Moved.
- Gold Silver Ratio at 64: What It Signals for Silver in 2026
- How Central Banks Decide How Much Gold to Hold
- How Much Does Gold Storage Cost? The $72-a-Year Answer
- Silver Price Outlook June 2026: The Correction Was the Setup
- Wall Street’s $6,000 gold call rests on data most investors never see