Does US debt drive gold prices? The CBO confirmed the U.S. paid $529 billion in interest in just the first half of fiscal 2026 — $88 billion a month. Gold is at record highs and climbing. Here's the fiscal mechanism every saver needs to understand before the next $88 billion bill arrives.
There is a number making the rounds this week that every saver should see: $88 billion.
That is what the U.S. government pays every month in debt interest alone — not infrastructure, not education, not defense. Just interest on $39 trillion in debt. The CBO’s Monthly Budget Review, released April 8, puts the figure in stark relief. The government paid roughly $529 billion in interest in just the first half of fiscal year 2026. Gold is up more than 46% year-over-year. It is reflecting this fiscal reality in real time.
Does US debt drive gold prices?
Yes — and right now the evidence is impossible to ignore. The U.S. government spends $88 billion every month on debt interest alone. That is over $1 trillion annualized. Add a weakening dollar, energy-driven inflation, and central banks buying more than 1,000 tonnes of gold in 2025. Investors are pricing in accelerating monetary debasement. Gold is at record highs and has gained more than 46% year-over-year as a result.
To put that in perspective: the monthly interest bill roughly equals what the government spends on defense and education combined. The national debt has crossed $39 trillion. CBO projections show interest costs doubling to $2.1 trillion by 2036. That is faster growth than any other category in the federal budget.
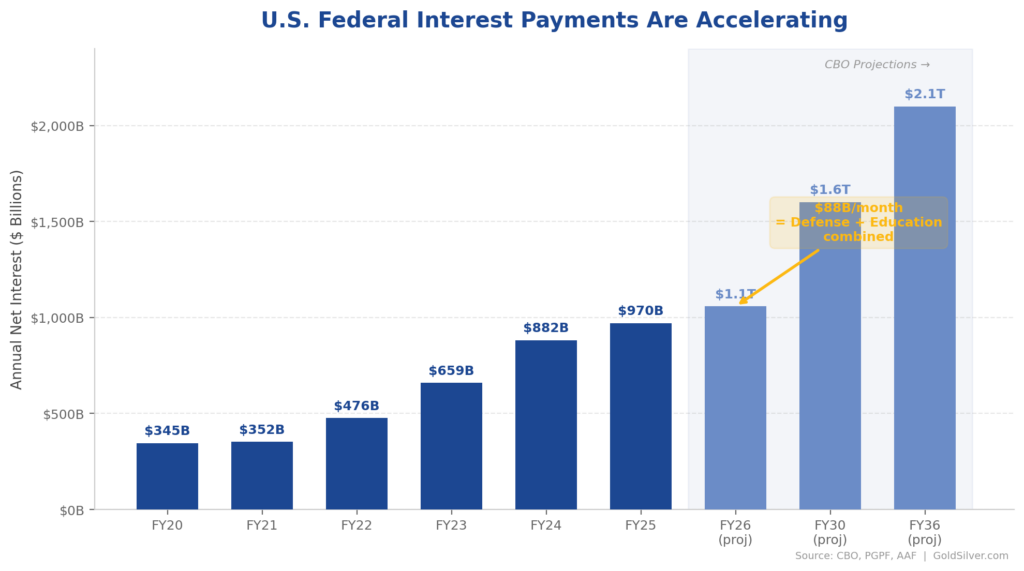
U.S. Federal Interest Payments Are Accelerating | Source: CBO, PGPF
This is the mechanism of monetary debasement, and it is accelerating.
Gold is reflecting exactly this reality. The metal traded near $4,749 on April 10. It held elevated levels despite volatility tied to the fragile U.S.-Iran ceasefire. Year-over-year, gold is up more than 46% — outpacing equities, bonds, and most other asset classes.
The ceasefire illustrates why the fiscal picture matters for precious metals. Markets initially rallied on the April 8 truce announcement. The relief proved short-lived. The Strait of Hormuz carries roughly 20% of the world’s oil. It remains effectively closed. Only two tankers have transited since the ceasefire, according to Matt Smith, lead oil analyst at Kpler. ADNOC CEO Sultan Al Jaber was blunt. In remarks reported by CNBC on April 9, he stated the strait is not open. Some 230 loaded oil tankers were still waiting inside the Persian Gulf, per Kpler vessel-tracking data.
Oil prices, which plunged 16% on the ceasefire headlines, have already bounced back near $97 per barrel — still roughly 40% above pre-war levels.
Stay Ahead with Gold & Silver News The most important market insights, Fed updates, and global trends — everything investors need to make smarter, safer decisions.
Why isn’t the Fed cutting rates to ease the debt burden?
Because inflation won’t let it. At the March FOMC meeting, the Fed held rates steady at 3.50%–3.75%. That was the second consecutive hold. The Fed also raised its 2026 inflation forecast to 2.7% on both headline and core PCE. The bind is well-known: energy inflation argues for tighter policy. A weakening labor market argues for easier money. Massive government debt makes cuts politically tempting but fiscally dangerous. Seven of 19 FOMC members now see no rate cuts at all this year. The dollar index has fallen to a four-week low. It dropped more than 1% on April 9 alone — a move that typically supports gold.
Is silver a better buy than gold right now?
Silver is significantly cheaper relative to gold by historical standards. The metal surged more than 5% to $76.70 per ounce on April 8. That was its highest level since mid-March. It has since pulled back slightly. Silver remains well below its January all-time high of $121.67. It suffered a steep 37% peak-to-trough decline in the first weeks of the Iran conflict. The gold-to-silver ratio sits near 63. That suggests silver has significant room to catch up if the broader precious metals thesis holds.
Step back from the daily price action and the larger picture comes into focus. Central banks purchased more than 1,000 tonnes of gold in 2025. That was the second-highest annual total in history. The drivers: de-dollarization and reserve diversification. That structural demand continues into 2026.
The U.S. fiscal trajectory tells the same story from a different angle. When a nation pays more to service past borrowing than it spends on defense or education, something fundamental has shifted. It is telling you where its currency’s purchasing power is headed.
Gold and silver have served as sound money for millennia. They cannot be printed, debased, or inflated away by government decree. Every month that $88 billion interest bill arrives, it reinforces the case. A deliberate allocation to physical precious metals is not speculation — it is financial self-defense.
The question is not whether gold is expensive at $4,749. The question is whether the dollar is cheap at $39 trillion in debt.
Investing in Physical Metals Made Easy

SOURCES
1. Congressional Budget Office — Monthly Budget Review: March 2026, April 8, 2026
2. Matt Smith, Lead Oil Analyst, Kpler — CNBC: Strait of Hormuz oil traffic way down after ceasefire, April 9, 2026
3. Sultan Ahmed Al Jaber, CEO ADNOC — CNBC: Strait of Hormuz oil traffic way down after ceasefire, April 9, 2026
4. Kpler vessel-tracking data — Al Jazeera: Shipping in Strait of Hormuz at a standstill despite US-Iran ceasefire, April 10, 2026
This article is for informational purposes only and does not constitute financial or investment advice. Always consult a qualified financial advisor before making investment decisions.
You May Also Like
- CPI Hits 3.3%, GDP Stalls — Is Stagflation 2026 Here?
- War Risk, Stagflation Signals, and a $6,300 Gold Target
- Gold and Oil Brace for the Strait of Hormuz Deadline
- Iran War Deadline Puts Gold and Silver Prices on Edge
- Why Is Gold Falling When the World Is on Fire?
- Gold Jumps 2% as Trump Plans Iran War Address Tonight