Published: 06-25-2026, 09:56 am
Gold ETF outflows are accelerating in 2026 because the rate-cut thesis that drove gold to $5,595 in January has reversed. The Federal Reserve has turned hawkish as Iran-war-driven oil prices reignite inflation. According to Standard Chartered analyst Suki Cooper, 298 tonnes of gold inside ETFs is now held at a loss — a structural supply ceiling on any near-term recovery.
Gold is trading near $4,009 an ounce this Thursday, June 25, 2026 — partially recovering from Wednesday’s break below $4,000 for the first time since November 2025. Silver is at $58.03. Both metals have shed roughly 29% from their January highs as the Federal Reserve’s hawkish turn under Chair Kevin Warsh reshaped market expectations. Meanwhile, the dollar sits at a 13-month high. Rate-hike odds for September stand at roughly 68% according to CME FedWatch, up from 29% just one week ago.
The paper market is telling a clear story. ETF holders bought gold on the rate-cut thesis. That thesis evaporated. Now they want out.
But beneath the paper market, a completely different set of buyers has not moved an inch.
What’s happening in the ETF market right now?
Gold-backed exchange-traded funds recorded net outflows of 16 metric tonnes in May 2026 and continued bleeding into the first half of June. Last week, however, they reversed course: a $1.1 billion inflow snapped four straight weeks of redemptions, according to World Gold Council ETF flow data published June 2026. That inflow snapback is encouraging, but the overhang remains. In a June 24 research note, Standard Chartered analyst Suki Cooper flagged that approximately 298 tonnes of gold inside ETFs is held at a loss at prices around $4,000. That is up from 270 tonnes when gold was still above $4,250. Those holders are not long-term buyers. They are traders waiting to exit. Every dollar of recovery toward their entry points creates potential selling pressure. That is a structural ceiling on the near-term rally — not a floor.
The overhang matters because of how gold ETFs work. When investors redeem shares, authorized participants deliver the underlying metal back to the market. A sustained wave of redemptions therefore becomes a supply event, not just a repositioning. Standard Chartered’s ~298-tonne figure represents roughly $38 billion worth of metal at current prices held by people with an incentive to sell rather than hold. For the structural floor analysis on the other side of this equation, see Deutsche Bank’s analysis of gold’s price floor.
Who is buying on the other side?
Here is where the two markets stop talking to each other. The World Gold Council’s 2026 Central Bank Gold Reserves Survey was published June 16. It found that 89% of reserve managers expect global central bank gold holdings to increase over the next 12 months. A record 45% of the 76 central banks surveyed plan to add to their own reserves. That is up from 43% in 2025, and it represents the broadest participation in the survey’s nine-year history.
Crucially, these are not rate-sensitive buyers. They do not have stop-losses. A central bank targeting a specific tonnage allocation to its reserves has a mathematical incentive to buy more when prices fall. Each ounce costs less, which moves the institution closer to its strategic target. ETF holders and sovereign reserve managers are playing a different game measured in different units of time.
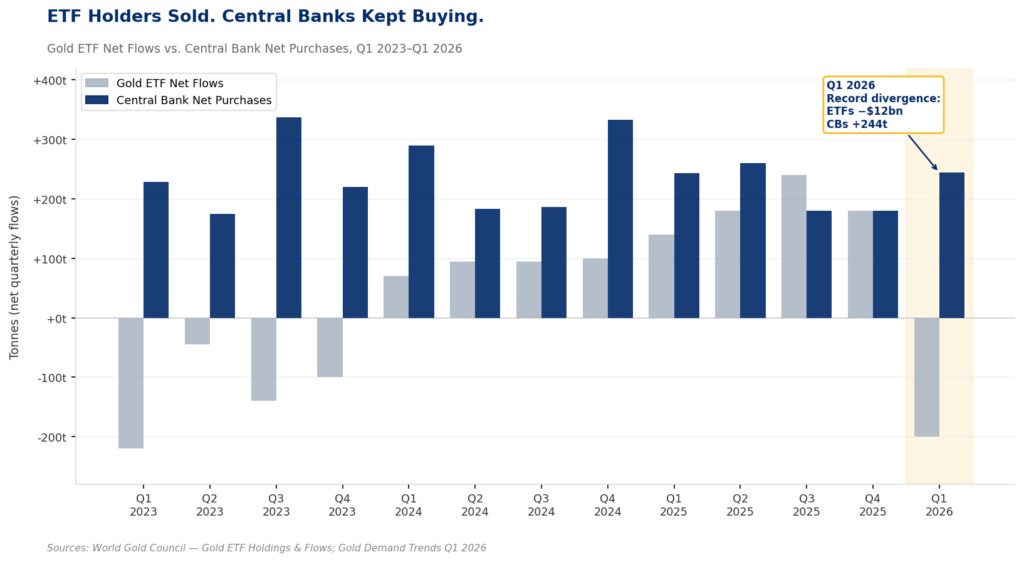
According to the World Gold Council’s Gold Demand Trends Q1 2026 report, released April 29, 2026, central banks bought a net 244 tonnes of gold in the first quarter. That exceeded both the prior quarter and the five-year average. Poland added 14 tonnes in April alone, bringing its year-to-date total to 45 tonnes. The People’s Bank of China extended an 18-consecutive-month buying streak. The Czech National Bank added 2 tonnes.
That purchasing activity continued even as gold sat 28% below its January peak of $5,595 per ounce. Even so, sovereign buyers did not pause on price.

The Edge Every Investor Needs Smarter precious metals investing starts here. The Nuggets Newsletter brings you essential market insights, Fed updates, global trends, educational videos, and much more.
What does the ETF-central bank divergence mean for gold’s price?
The surface take is that ETF outflows are bearish. That reading is technically correct but structurally incomplete.
In practice, what the divergence actually shows is a regime change in who sets the marginal price of gold. Through 2025, Western ETF buyers were the dominant flow. Their buying accelerated throughout the year as rate-cut expectations grew. They drove gold from $3,865 in October 2025 to $5,595 in January 2026 — a 45% move in roughly four months. When the Iran war changed the Fed’s calculus in March, those same buyers reversed. The ETF flow swung from record inflows to record outflows. As a result, gold fell.
But central banks, operating on decade-long mandates rather than quarterly rebalancing windows, absorbed part of that selling. The ECB confirmed in its June 2026 International Role of the Euro report that gold has surpassed US Treasuries as the world’s largest reserve asset. Gold now accounts for 27% of global central bank holdings, versus 22% for Treasuries. That shift was driven by two forces simultaneously: sustained buying that doubled official-sector gold demand after 2022, and gold’s price appreciation amplifying the existing stock. Neither force is reversible on a quarterly timeline.
Does the central bank bid offset the ETF overhang?
The ~298-tonne underwater ETF overhang is real. It will cap the near-term rally. But sovereign buyers are not going away. The WGC survey found that 74% of central banks expect the US dollar’s share of global reserves to decline over the next five years. The structural impulse to accumulate non-dollar assets is therefore not a 2026 phenomenon — it is a multi-year reallocation already in progress.
When the ETF overhang clears — either through price appreciation past those entry points or through time — the sovereign bid will still be there. It was there through the selloff. It will be there through the recovery.
For long-term holders of physical gold and silver, the relevant question is not what ETF redemptions are doing to this week’s price. It is who has the longer time horizon, the clearer mandate, and the deeper pocket. That ~298-tonne overhang has a finite ceiling. The structural shift in central bank reserve allocation does not.
What should gold investors watch next?
This morning at 8:30am ET, the May PCE inflation reading was released. It is the Fed’s preferred inflation gauge — and the number most likely to move rate-hike probabilities into next week. If core PCE came in at or above the 3.3–3.4% consensus, it extends the dollar’s run and keeps the ETF overhang in place longer. A soft print below 3.3% would begin to ease September hike odds and potentially remove some of the break-even selling pressure from underwater ETF holders. The next FOMC meeting is July 28–29.
Stay On Top of Gold & Silver Prices
Get important market alerts sent straight to your inbox.
SOURCES
1. Reuters — Gold ETFs Could See Fresh Outflows on Rising Bets on Fed Tightening, June 24, 2026
2. World Gold Council — ETF Holdings & Flows (June 2026); Central Bank Gold Reserves Survey 2026 (June 16, 2026); Gold Demand Trends Q1 2026 (April 29, 2026); Central Bank Gold Statistics April 2026 (June 3, 2026)
3. Mining.com — Gold Overtakes US Treasuries in Global Reserve Shift: ECB, June 2026
4. CME Group — FedWatch Tool, September 2026 Rate Hike Probabilities, June 25, 2026
Disclaimer: This article is for informational purposes only and does not constitute financial or investment advice. Always consult a qualified financial adviser before making investment decisions.
You May Also like:
- Hawkish Fed, Gold Below $4,000, Silver Below $60 — and a Market That Disagrees.
- Gold Just Broke $4,000. The Mainstream Called the Debasement Trade Dead. They’re Wrong.
- Two Things Are Hitting Gold Simultaneously. Only One Is About Gold.
- Why Is Silver Down 5%? The Gold-Silver Ratio Explains.
- BofA Says Three Rate Hikes. Silver Just Priced In the First One.
- Iran Deal. Oil Falling. A PM Out. Gold Still Above $4,100.
- PCE Drops Thursday. Here’s What It Means for Gold.